Business Units
Once the requirements have been met at the company level, the actual strategy development takes place on the business unit level. This is primarily about the market strategies.
Here we go through the strategy process step by step, from the requirements (here at the BU level) through the analysis, the design and planning to the formulation of measures.
Requirements
The requirements at the GF level are derived from the requirements at the company level, but they are specific to the this BU.
- Description of the business unit
- Description of the business model with the eBMC
- Income statement
- Financial goals
- Strategic goals

Business Unit
The form "Business Field Description" contains the description fields that have been specified for the instruments:
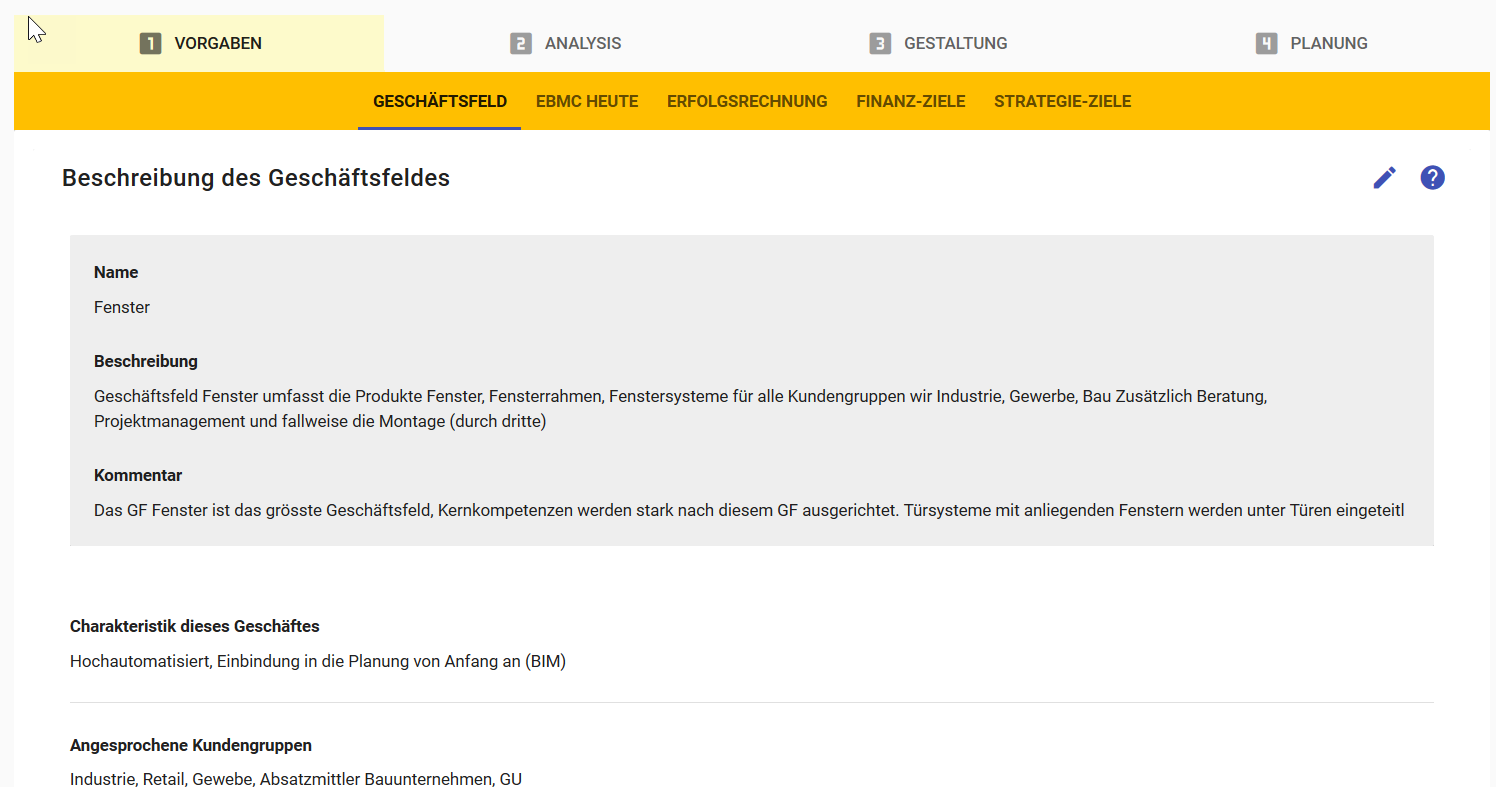
These details can also be edited as usual in the dialog box:
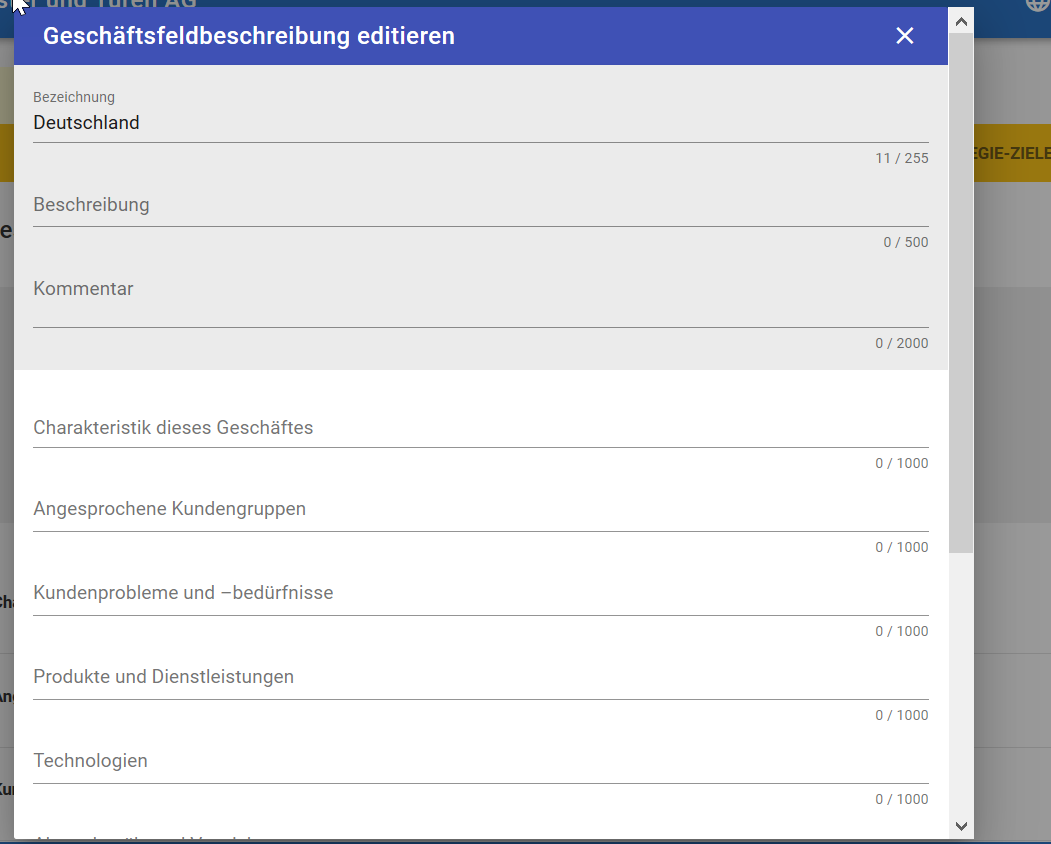
eBMC Today
The second instrument for describing the business units is the eBMC (Extended Business Model Canvas).
This describes the characteristics of the individual dimensions of our business unit.
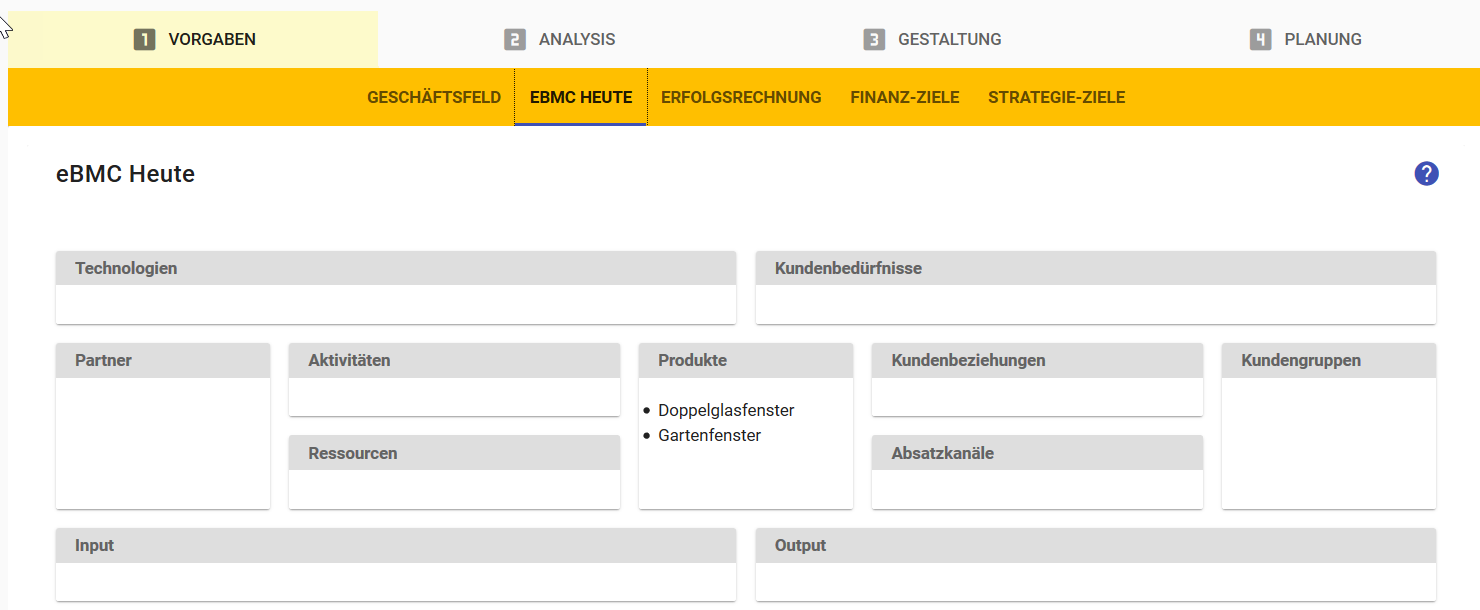
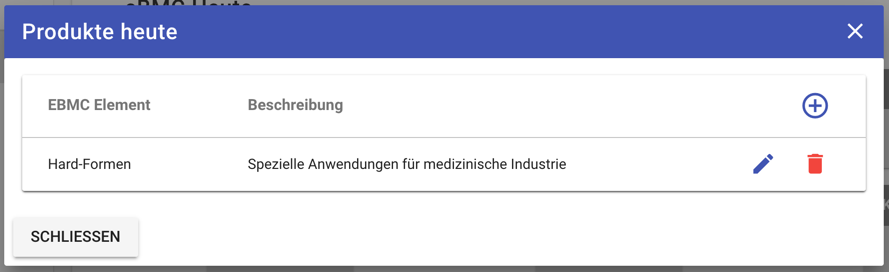
Click on a field and the list will appear, can be customized and expanded. The list of elements for a dimension can be entered, adjusted and deleted.
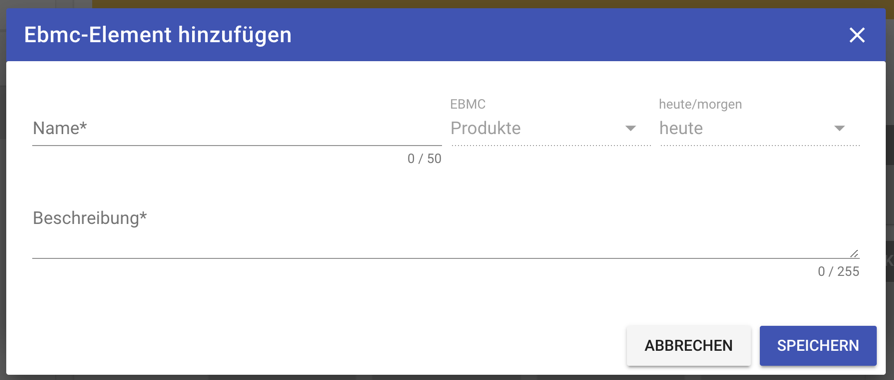
We will fall back on this basis in the design again.
We leave it to you whether you want to use both instruments - or whether you want to do without one of them.
Proft and Loss
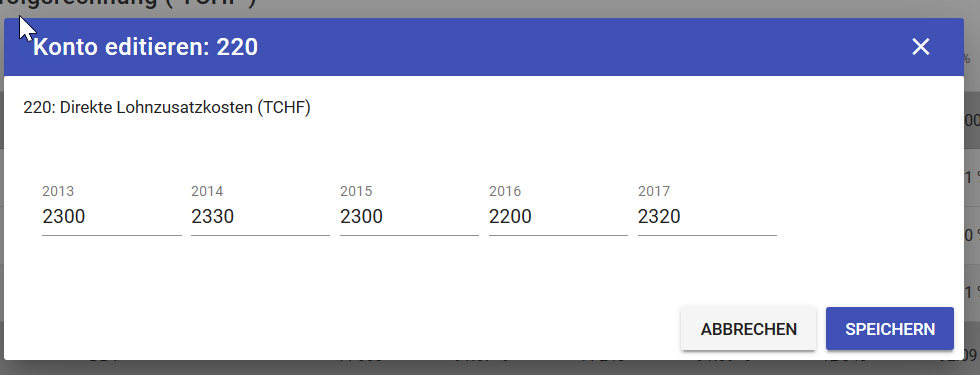
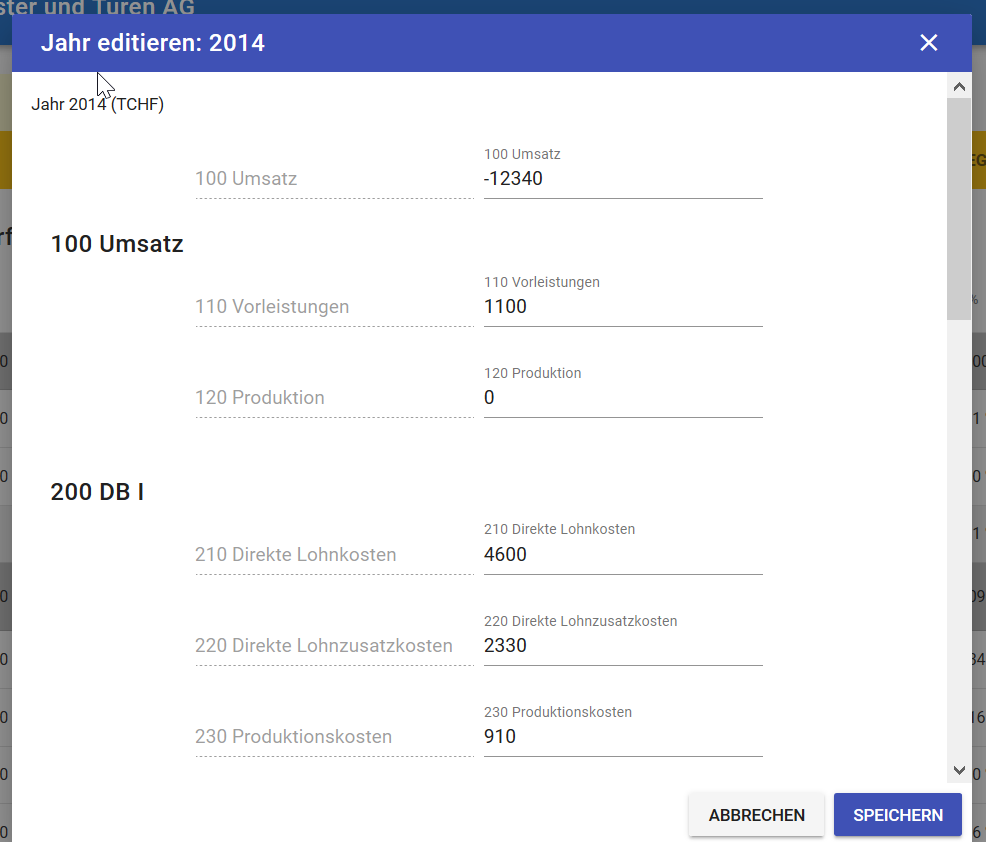
If the figures are available in the profit and loss account at the business unit level, they can be entered here. The entries can be made by year or by account.
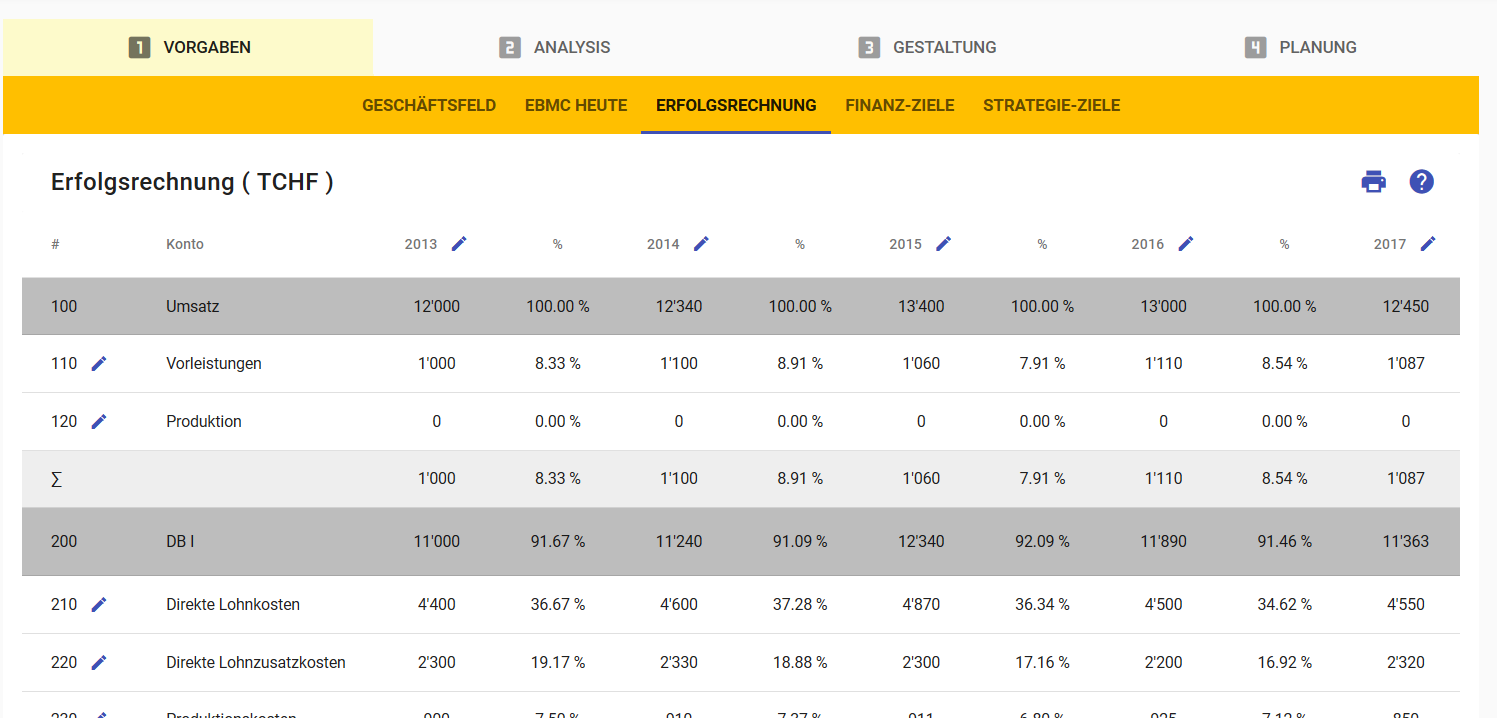
Clicking on an account number opens the dialog for entering lines.
With a click on a year, the dialogue opens and you fill in the numbers.
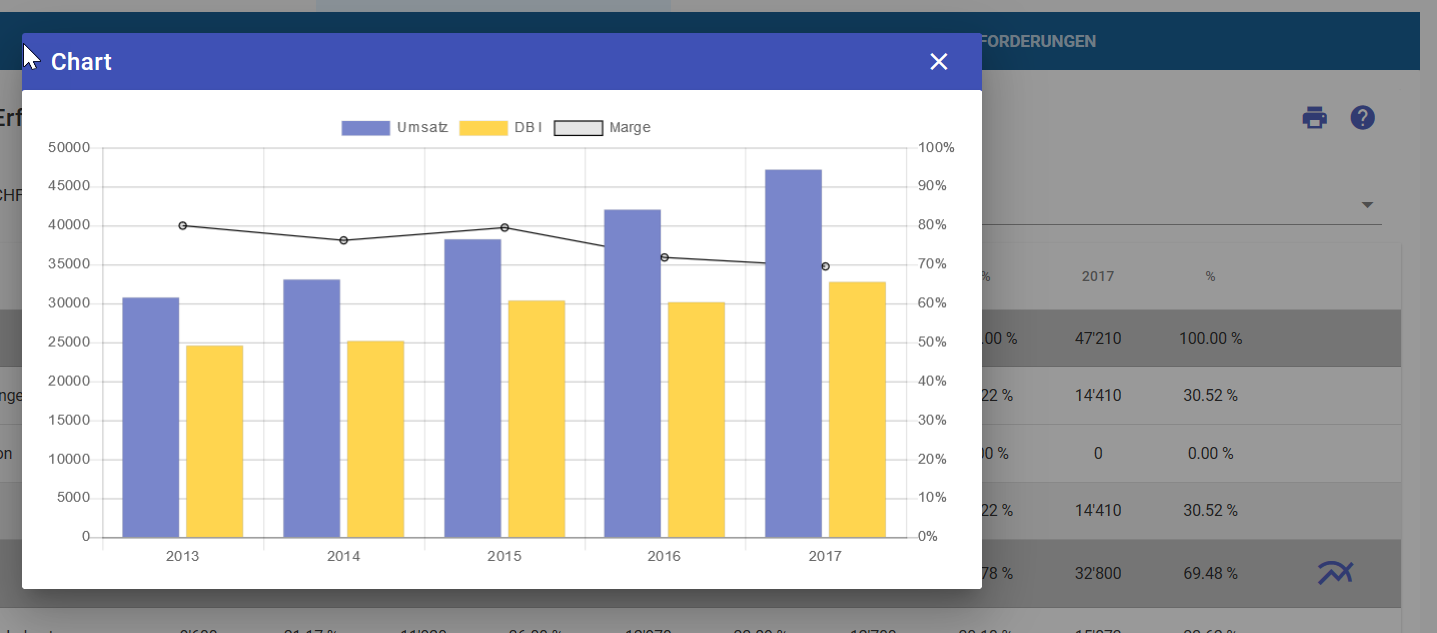
On the right is on the lines of the contribution margins an icon for the chart. This takes each of the sales and represents the contribution margin as an absolute number and as a percentage of sales. This percentage refers to the right axis.
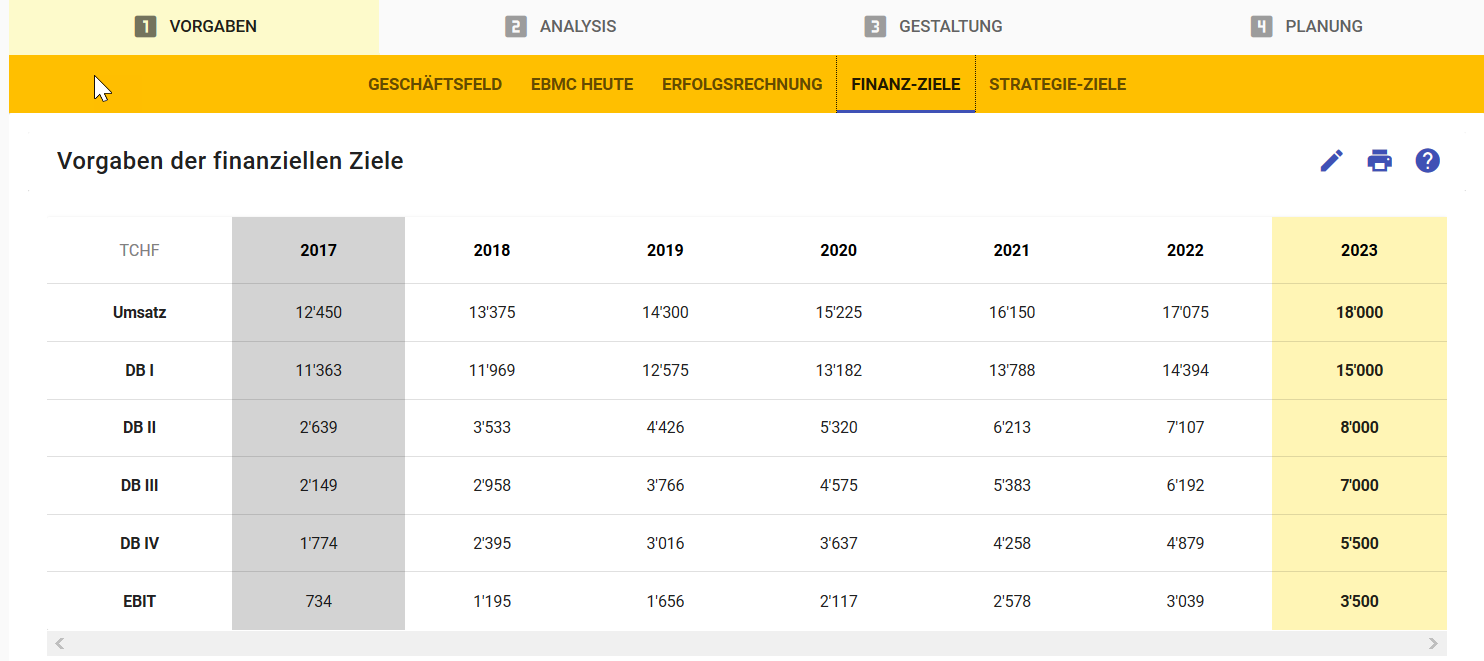
Financial Goals
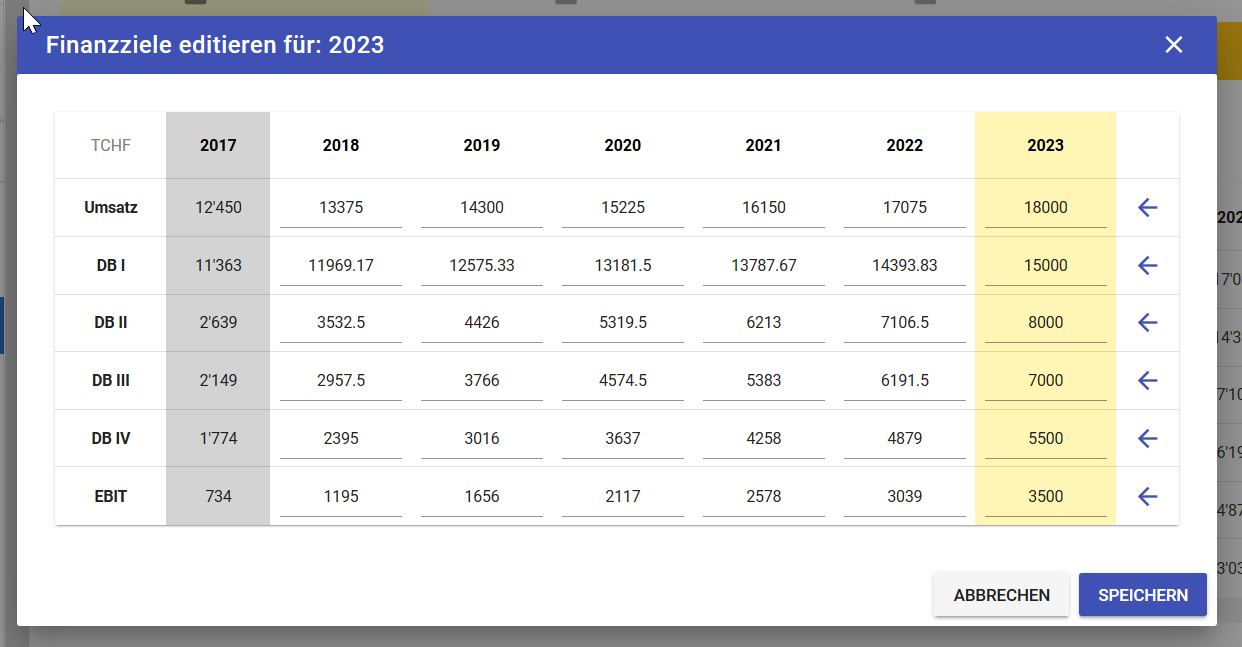
The financial targets can be specified for each contribution margin defined in the chart of accounts. The input and editing is done via the Edit-Icon, which opens the dialog box:
These goals can be entered separately for each following year. Alternative enter the target for last year and click on the icon on the right (left arrow); thus, the goal is linearly calculated back to the current year and distributed.
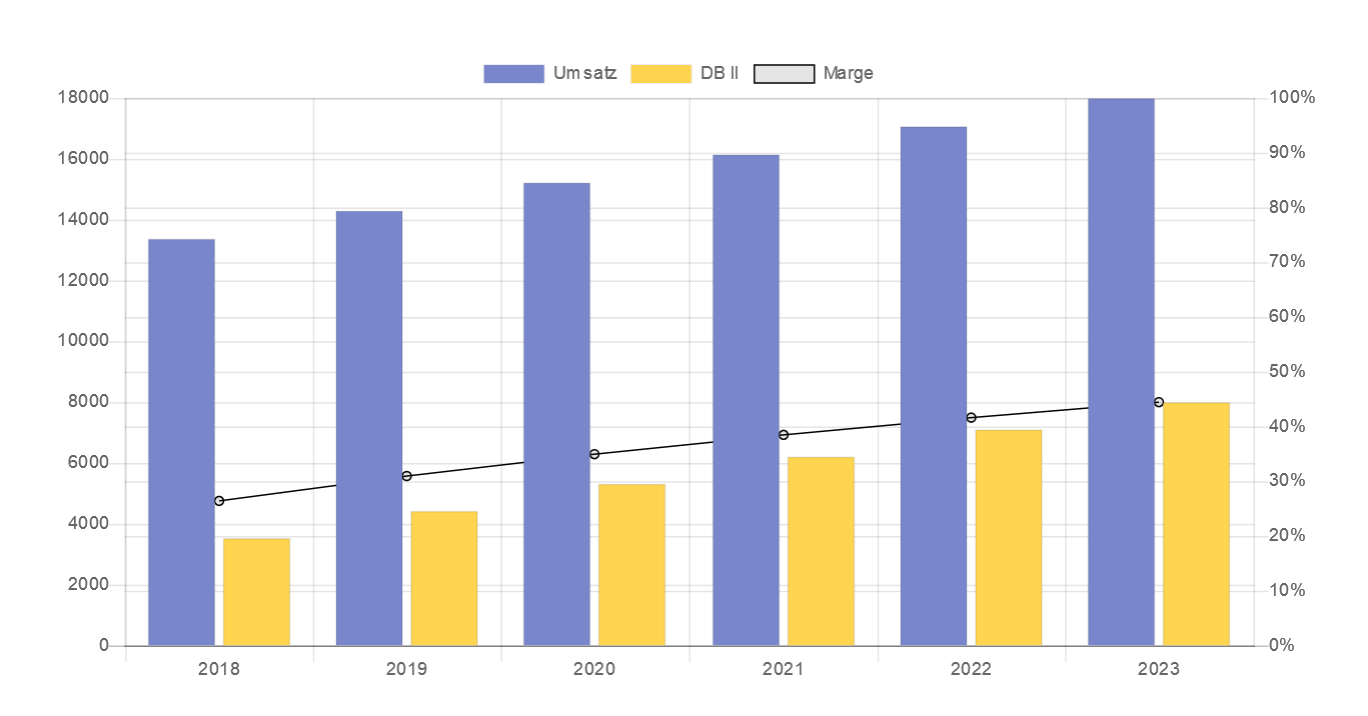
Click on a line to display the CM as a chart
Strategic Goals
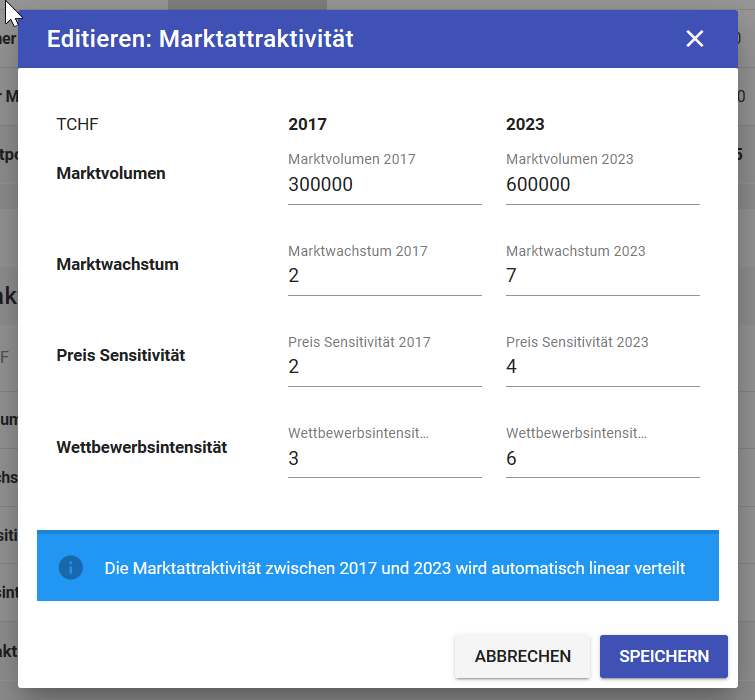
For the strategic goals of the BU, we use the parameters of the BU portfolio. These parameters are set under tools. The targets entered are for the last year specified in the timeframe. That the numbers we enter are set to this year and are calculated back linearly to the current year.
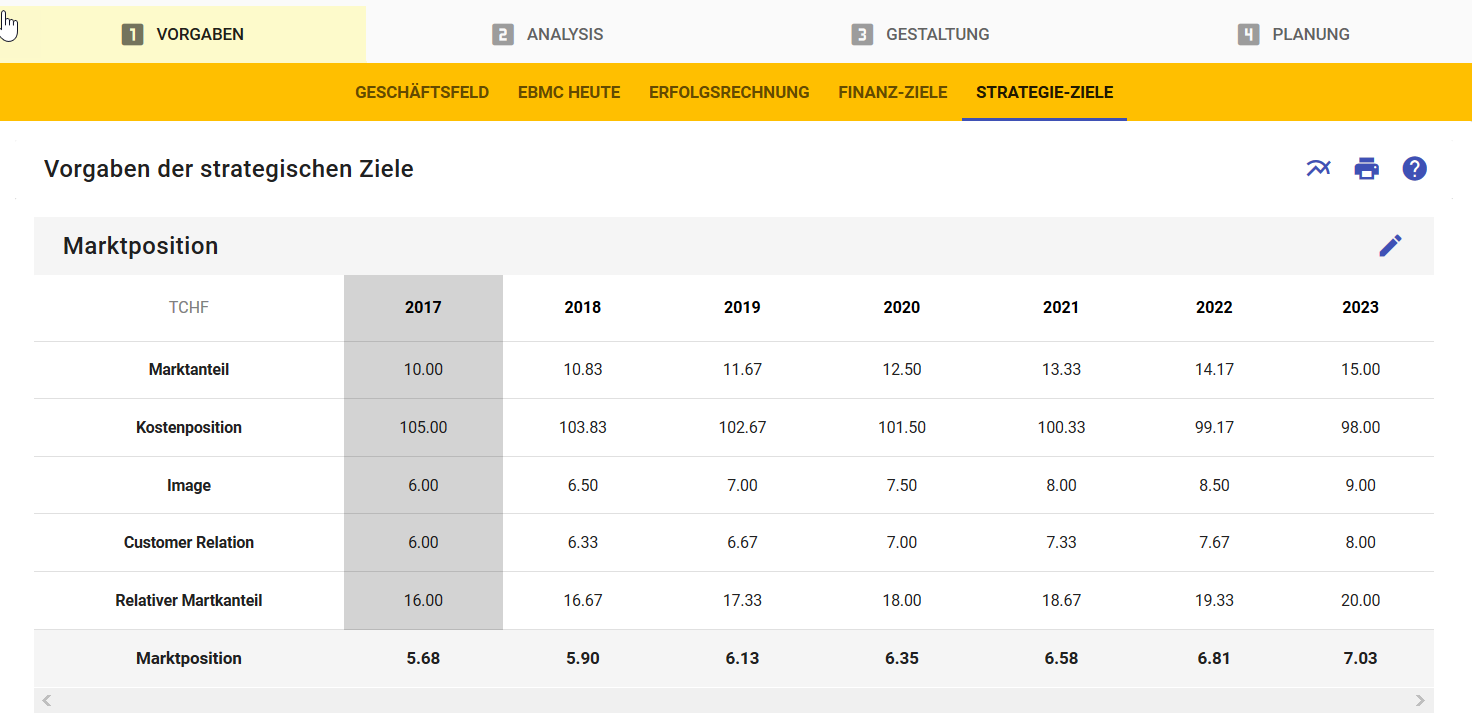
The input and editing is done via the Edit-Icon, which opens the dialog box:
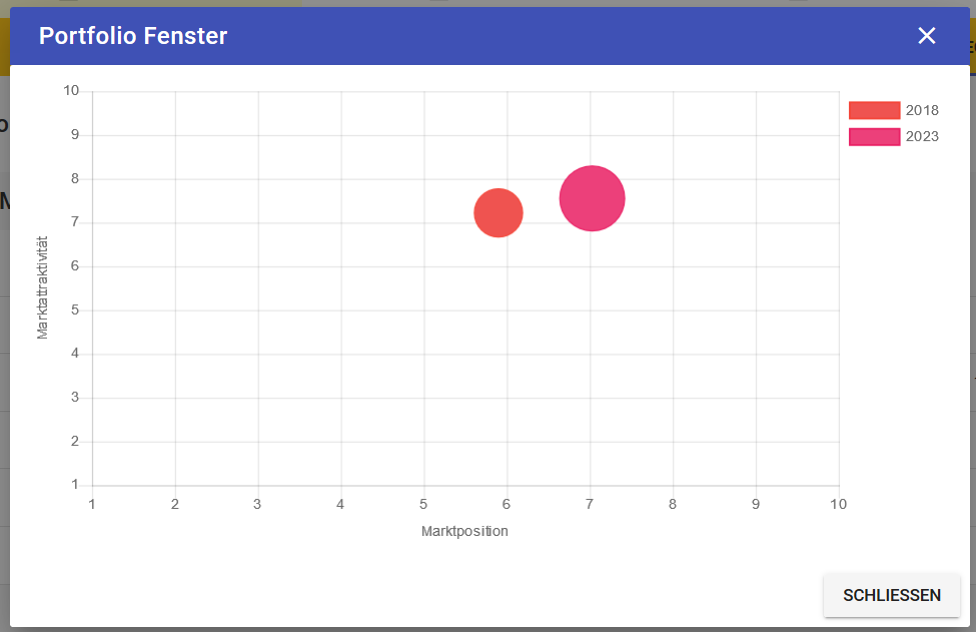
With the diagram icon, the targets per CM level can be displayed as a chart.
Analysis Phase
The Analysis section lists all instruments that are used by default or that you have selected. For each of these instruments, the SWOT elements are derived, which then merge into the SWOT. As a summary of the analysis, the SWOT will appear at the end.

Profit and Loss
For the analysis, the SWOT elements are derived from the income statement and recorded below the table:
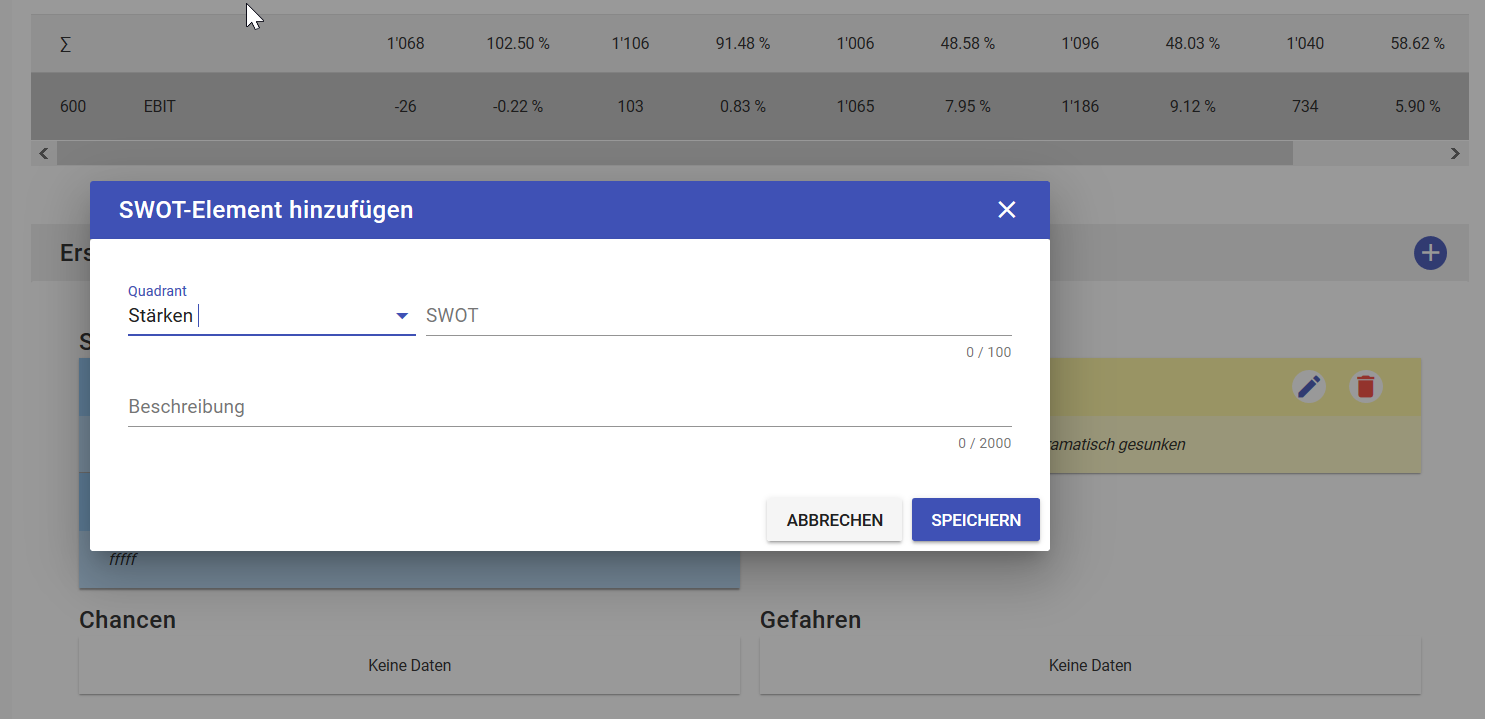
These elements appear subsequently in the SWOT, indicating the origin.
Competitors
All competitors assigned to this business unit in the BU- Competitors-Matrix appeare here in a list.
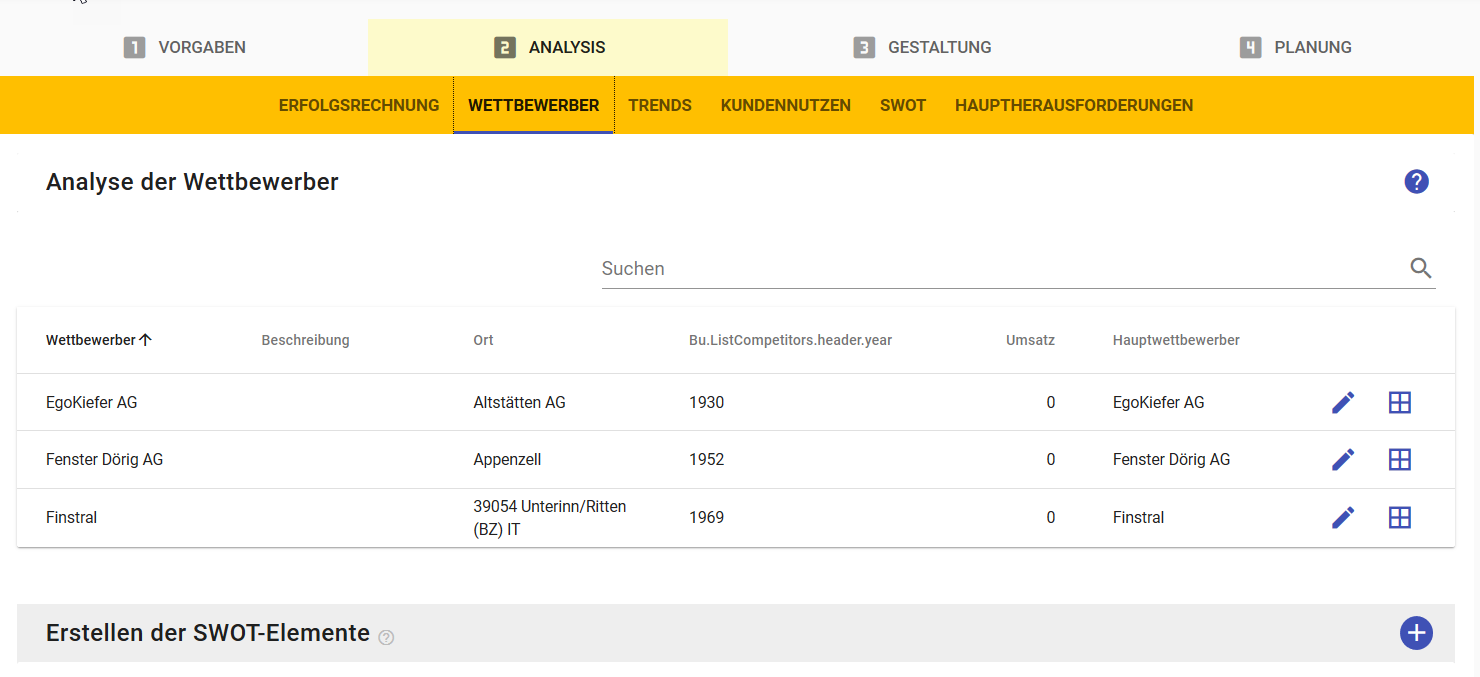
There are two dialog windows available:
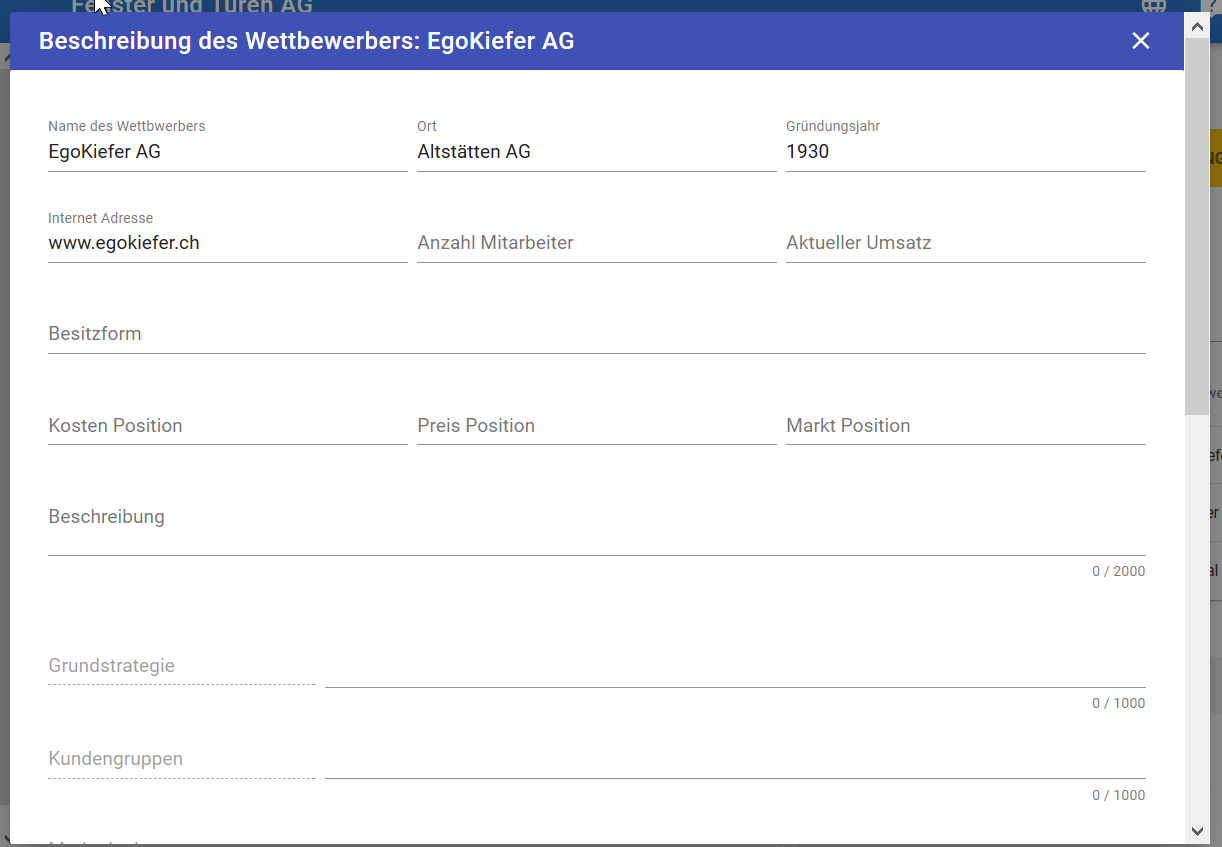
- Edit: Input and adjustment of competitor data and descriptions
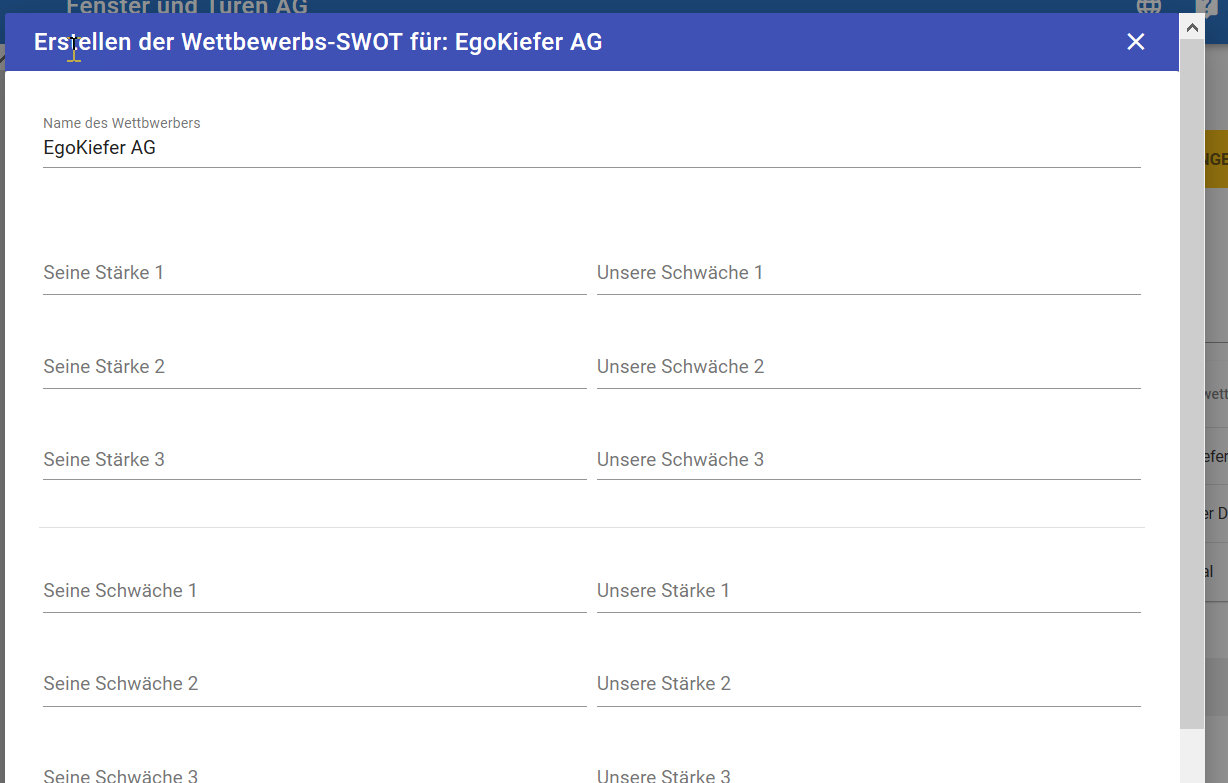
- SWOT: Enter each of the three strengths and weaknesses of the competitor and the corresponding weaknesses and strengths of your company, which they face.
Editing competitors:
Indicate the strengths and weaknesses of each competitor:
Below are the input fields for creating SWOT elements for the SWOT of this business unit.
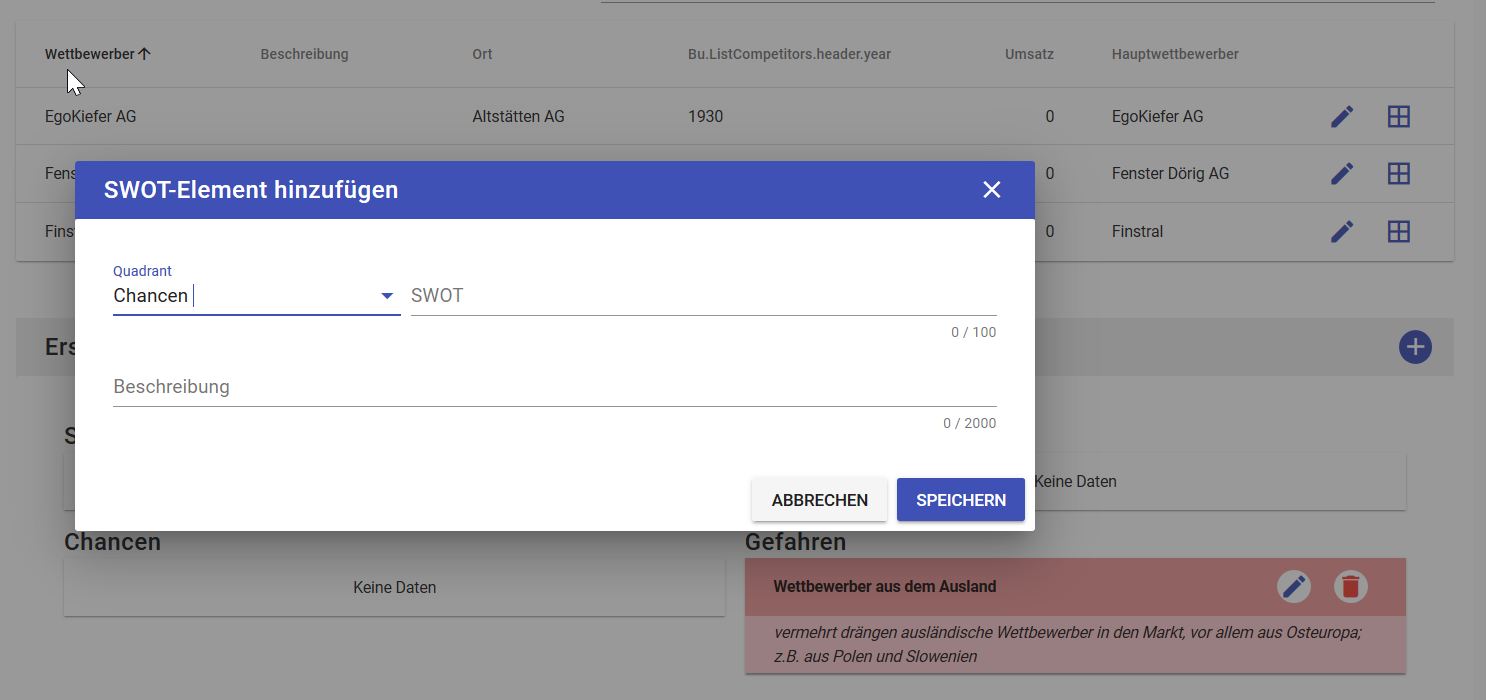
The elements entered here will subsequently be included in the SWOT of the relevant business area.
Trends
The trend analysis is the basic instrument for strategy development and should be used accordingly. We divide the trends into three groups:
- External trends
- Internal trends
- Competitive trends
These three groups appear as a list and can be expanded.
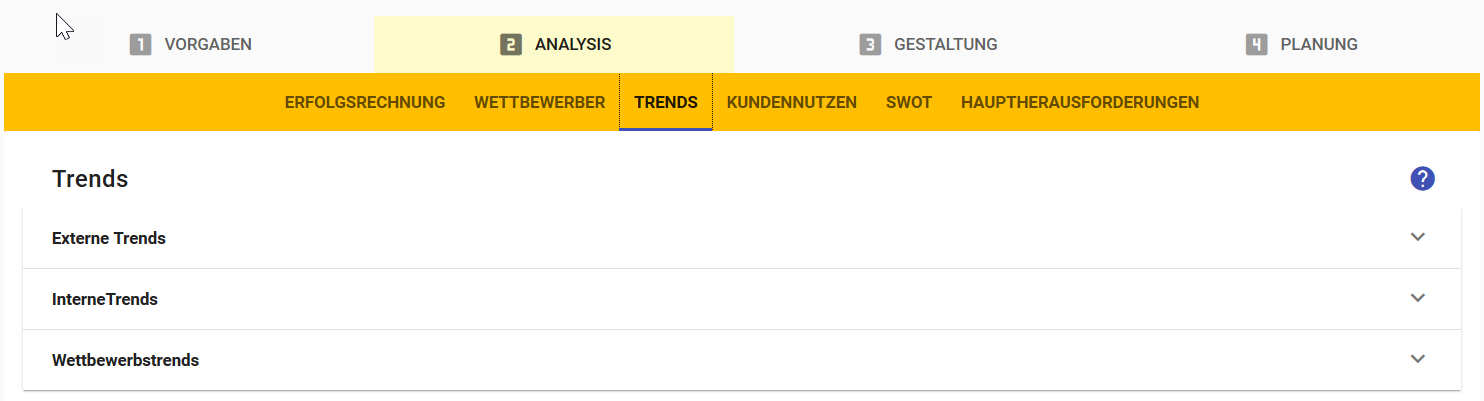
Click on a line to enter and edit the individual trends:
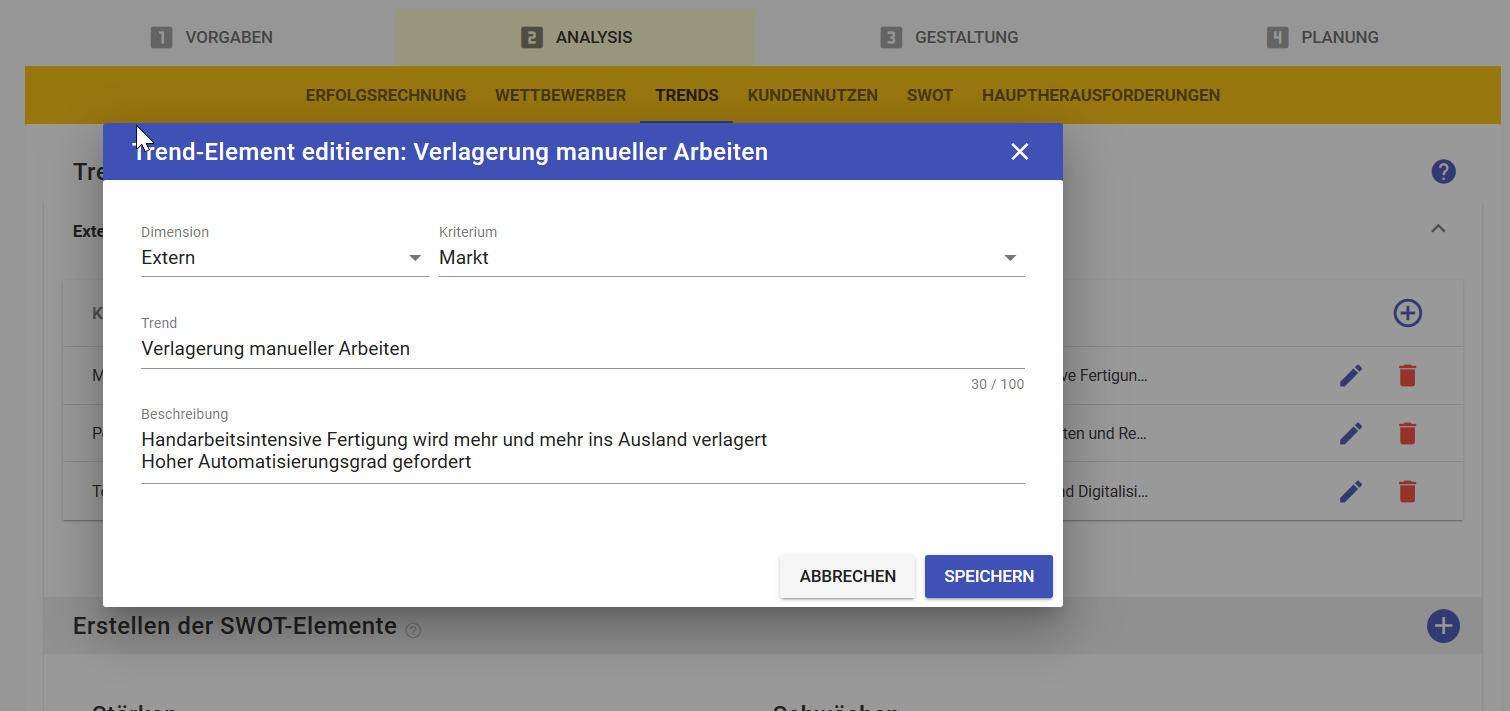
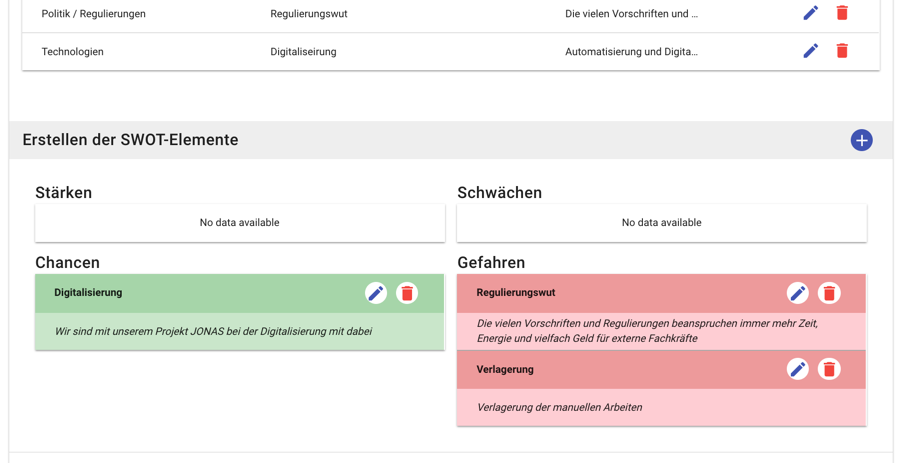
From each group, the SWOT elements can be derived, which then flow into the corporate SWOT.
Customer Value
A customer value analysis can be created for each business unit. A detailed tutorial with an example can be downloaded with the download icon on the top right. The instrument is divided in three parts:
- Input form customer value
- the diagram Value-Map
- the chart attribute-chart
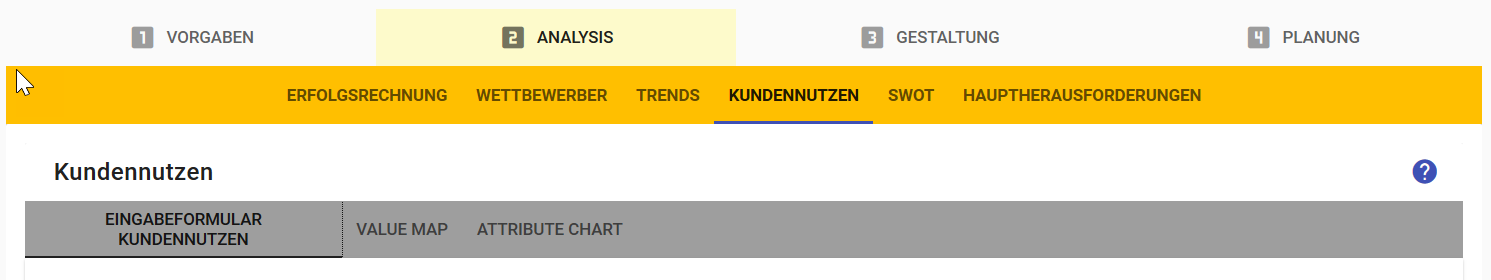
The input form contains the data for the customer value analysis:
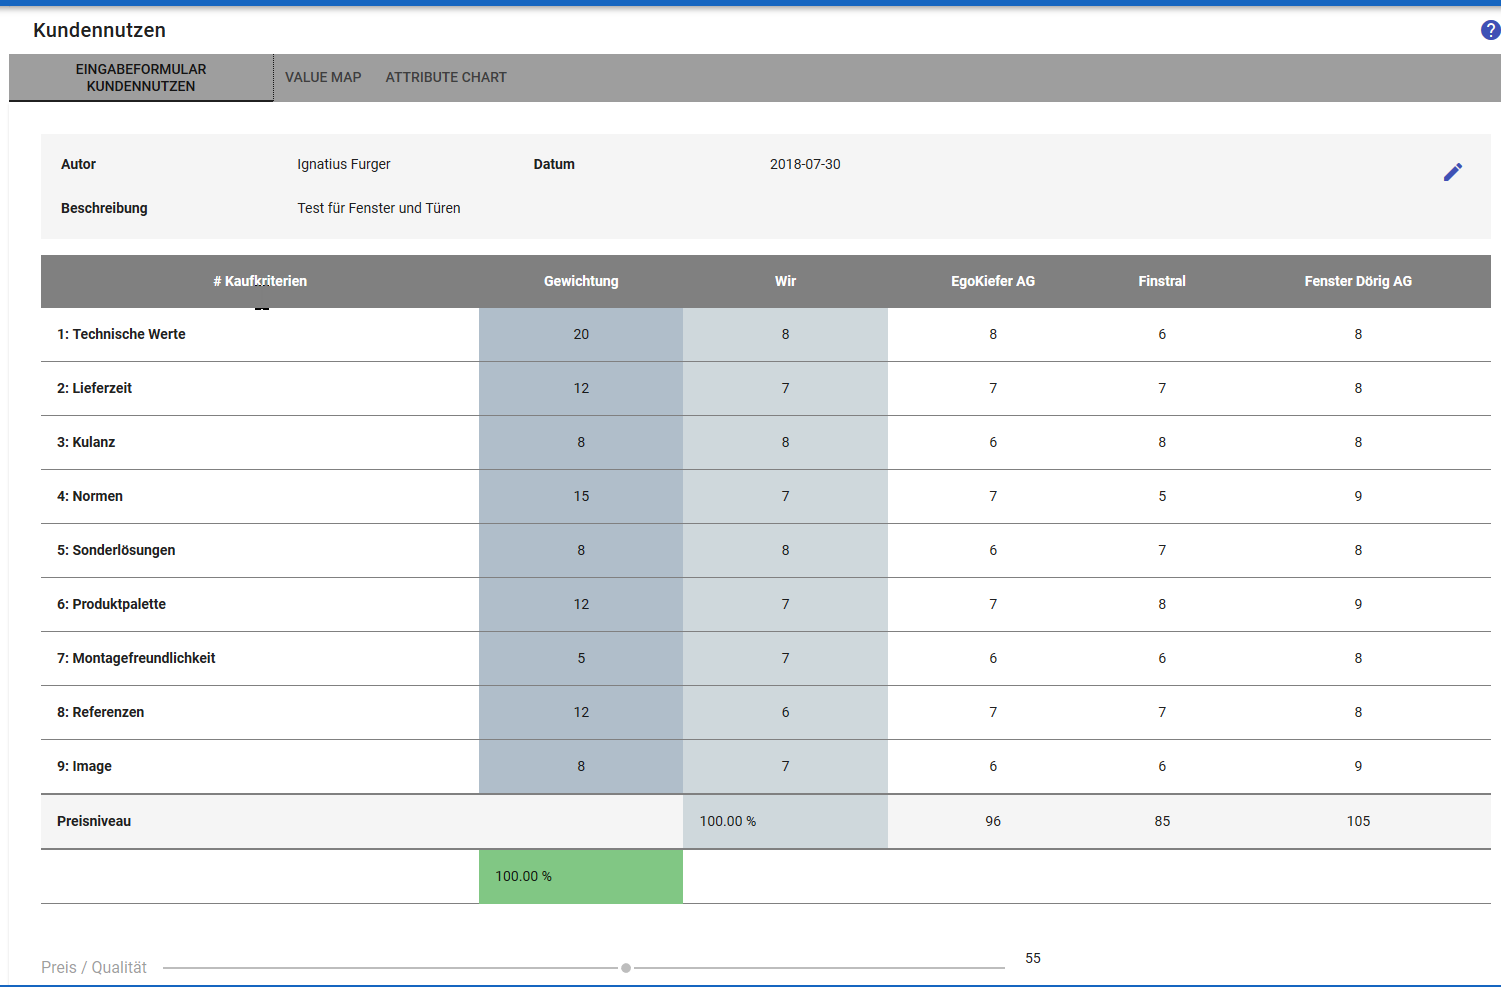
We recommend that you follow the order of the following steps:
- Description of the analysis
- Add the competitors. Attention: Only competitors who have been assigned to this business unit in the configuration can be added._
- Weighting of purchase criteria
- Assess the extent to which we meet these criteria - vertically - on a scale of 1-10
- Assessment of the extent to which competitors meet the criteria - horizontal
- Weighting of the price level
- Weighting the ratio of price to quality
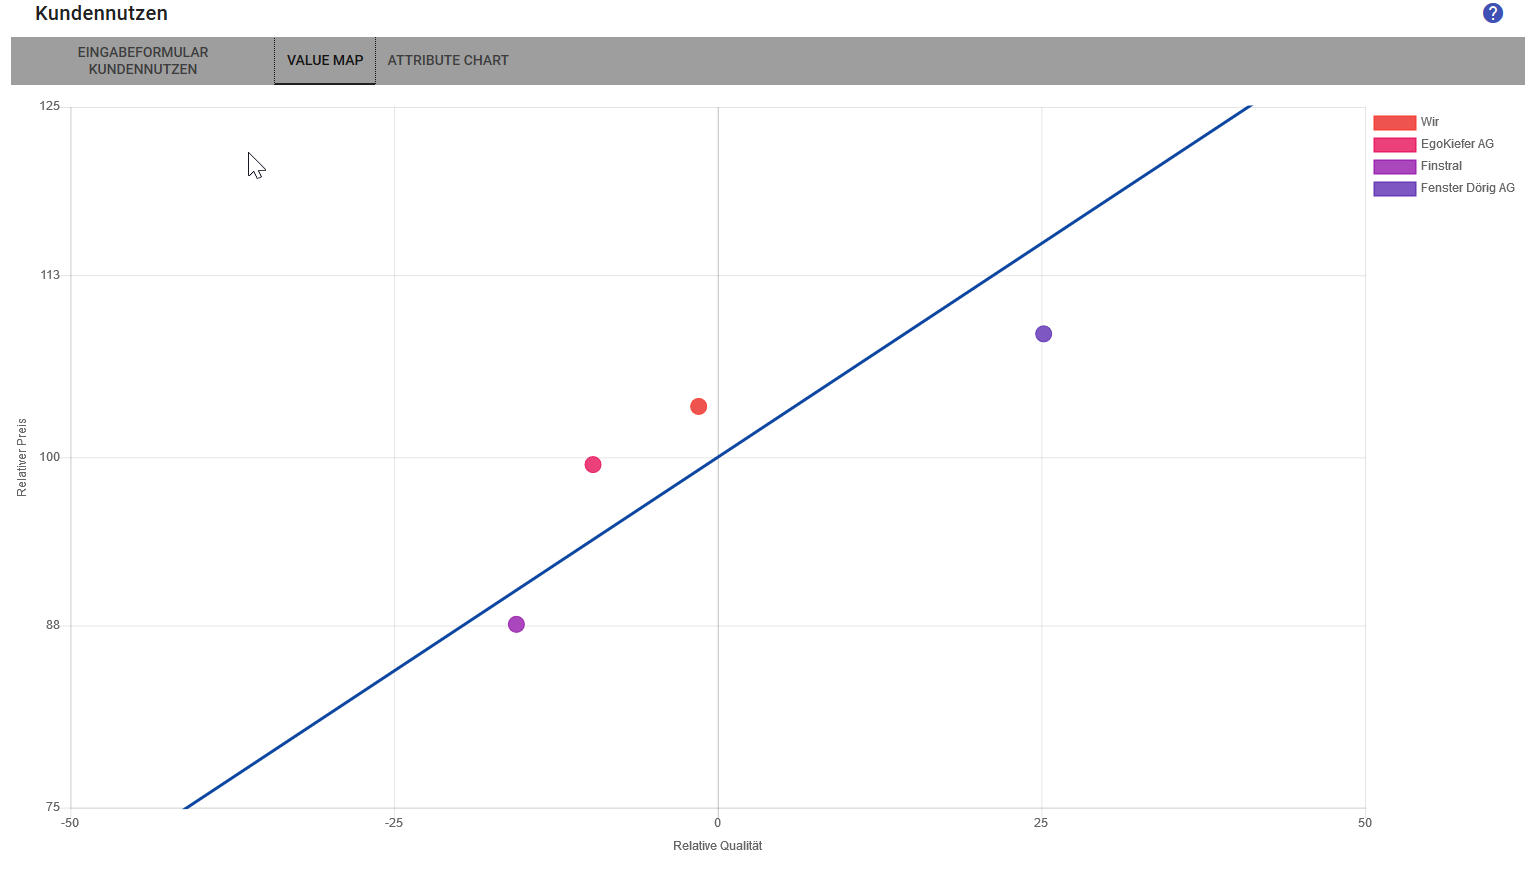
As a first evaluation we get the so-called Value Map with the axes "Relative quality" and "Relative price"
And as second diagram the Attribute Chart: with the axes weighting and delta to the competition:
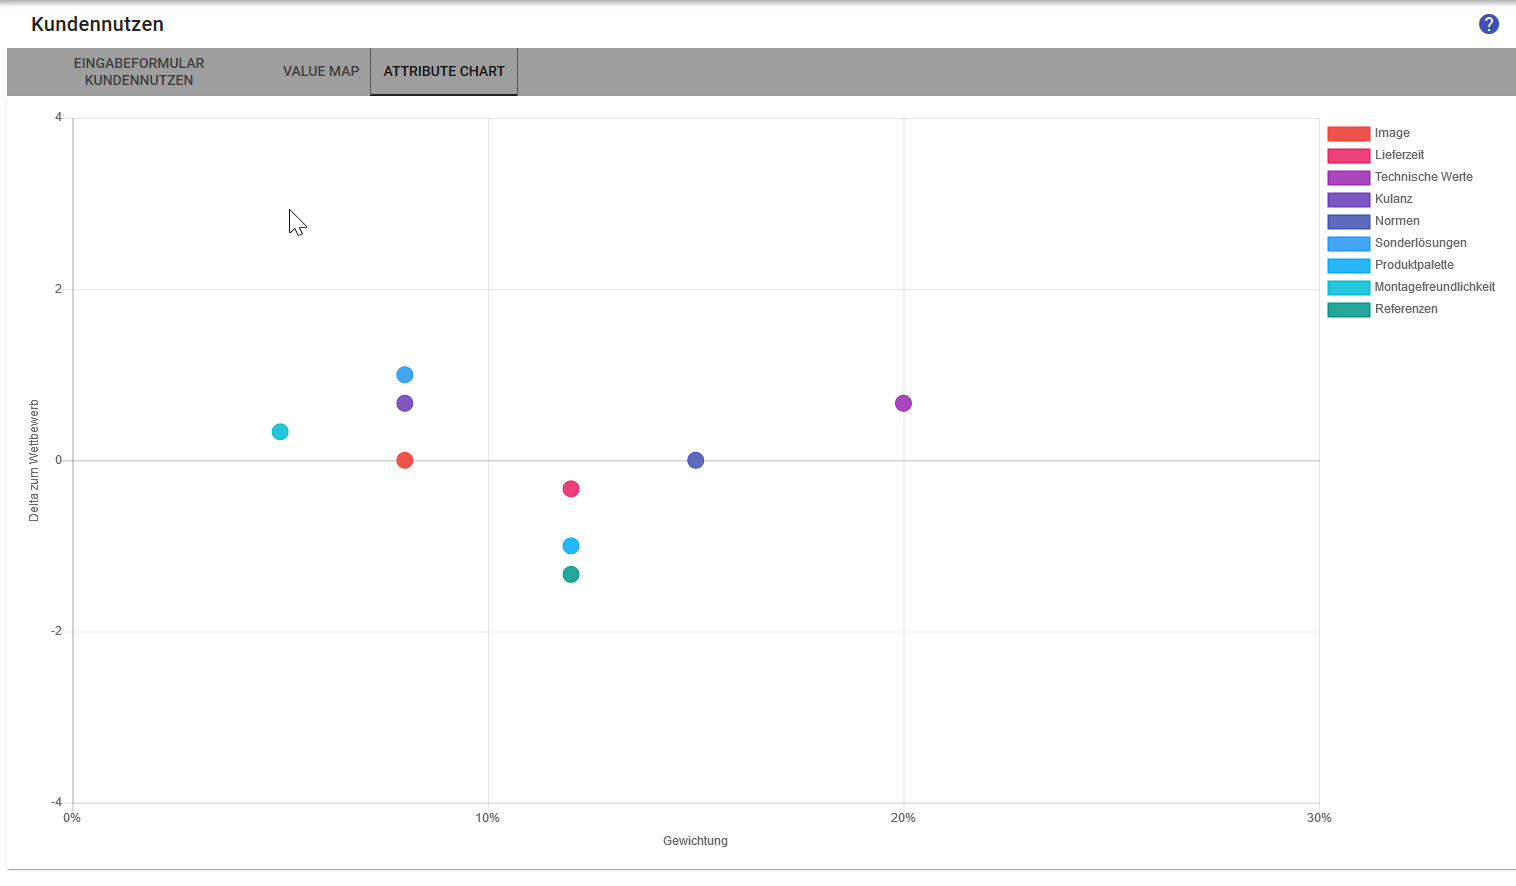
From these results, the SWOT elements are derived again, which are then displayed in the SWOT:
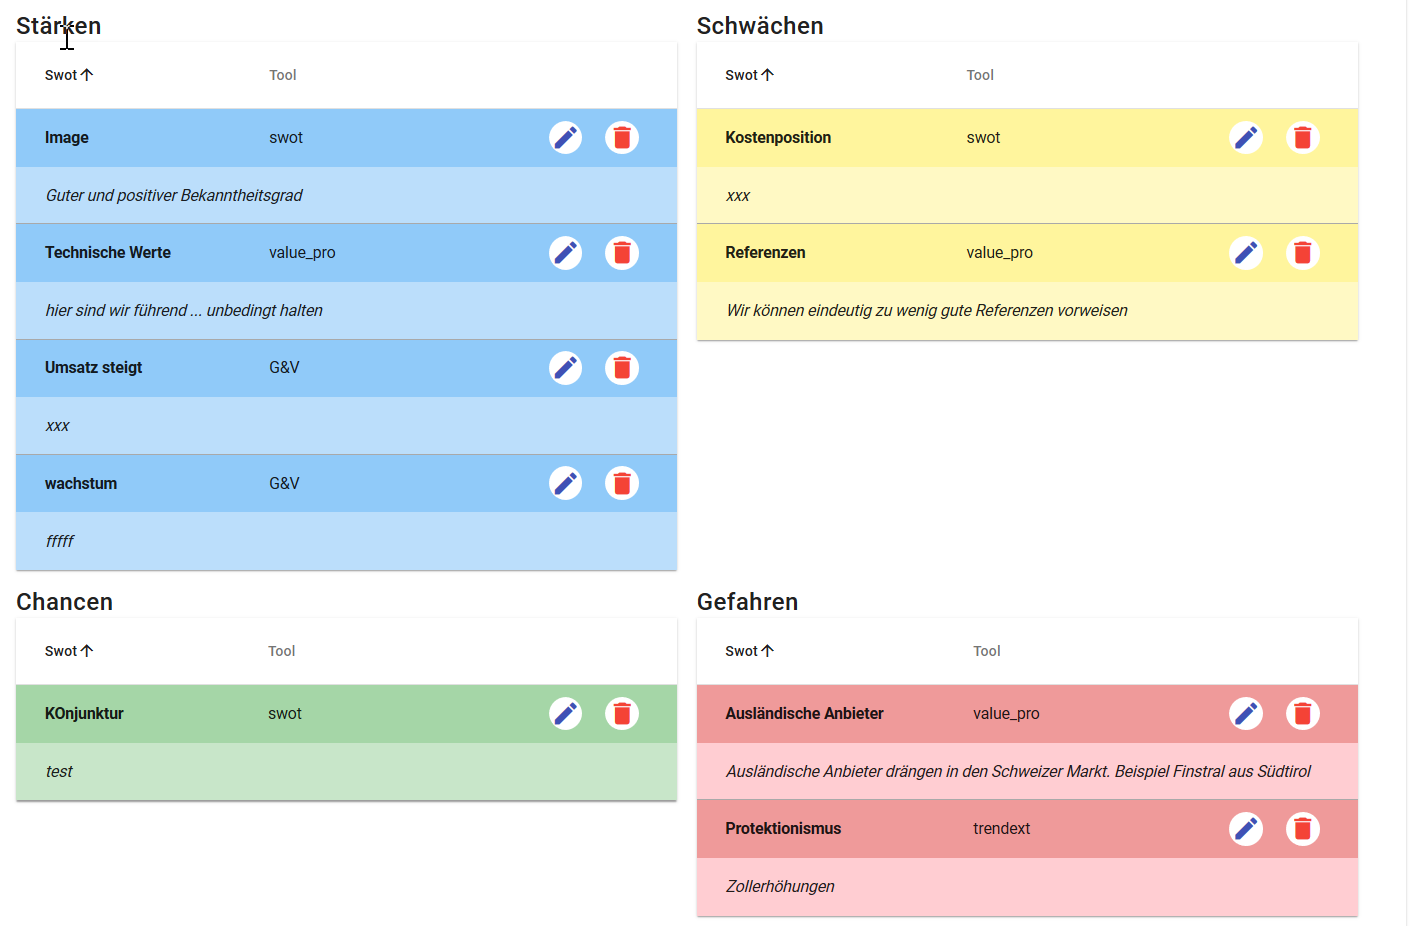
SWOT
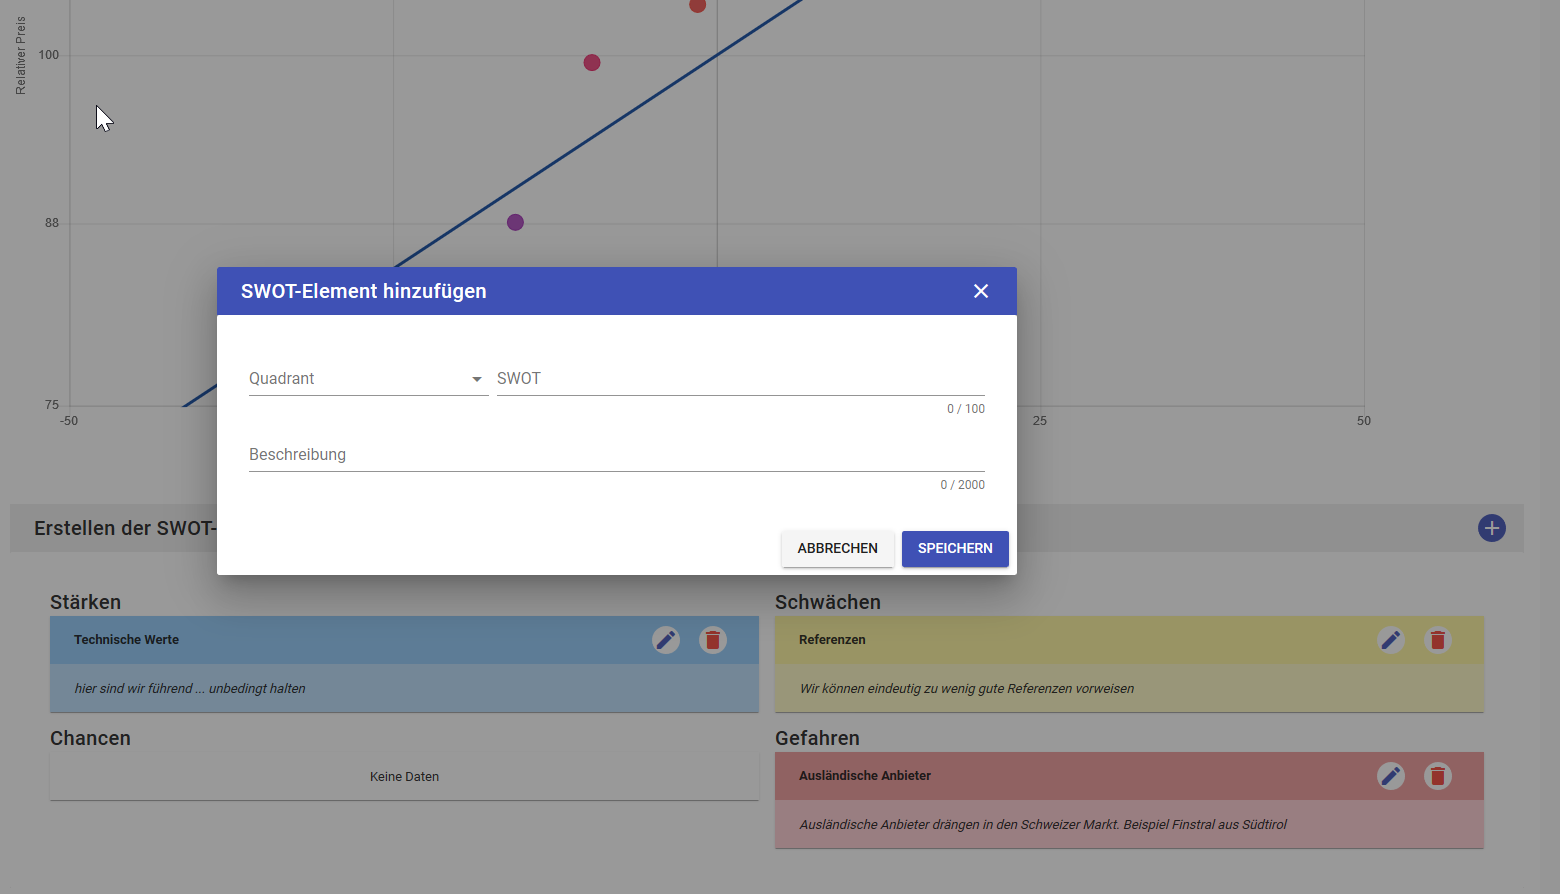
The SWOT is the result of the analysis. All SWOT elements from the analysis tools appear here in a long list, which is listed on the left. Partially overlapping there might be double entries and the elements may not all be equally relevant.
The elements can be further edited here and it is also possible to add more, e.g. as a summary of existing ones.
To obtain an aggregated summary of the assessment of the initial situation, select the three to a maximum of seven relevant elements from the list on the left per quadrant and drag them to the right by clicking on the arrow.
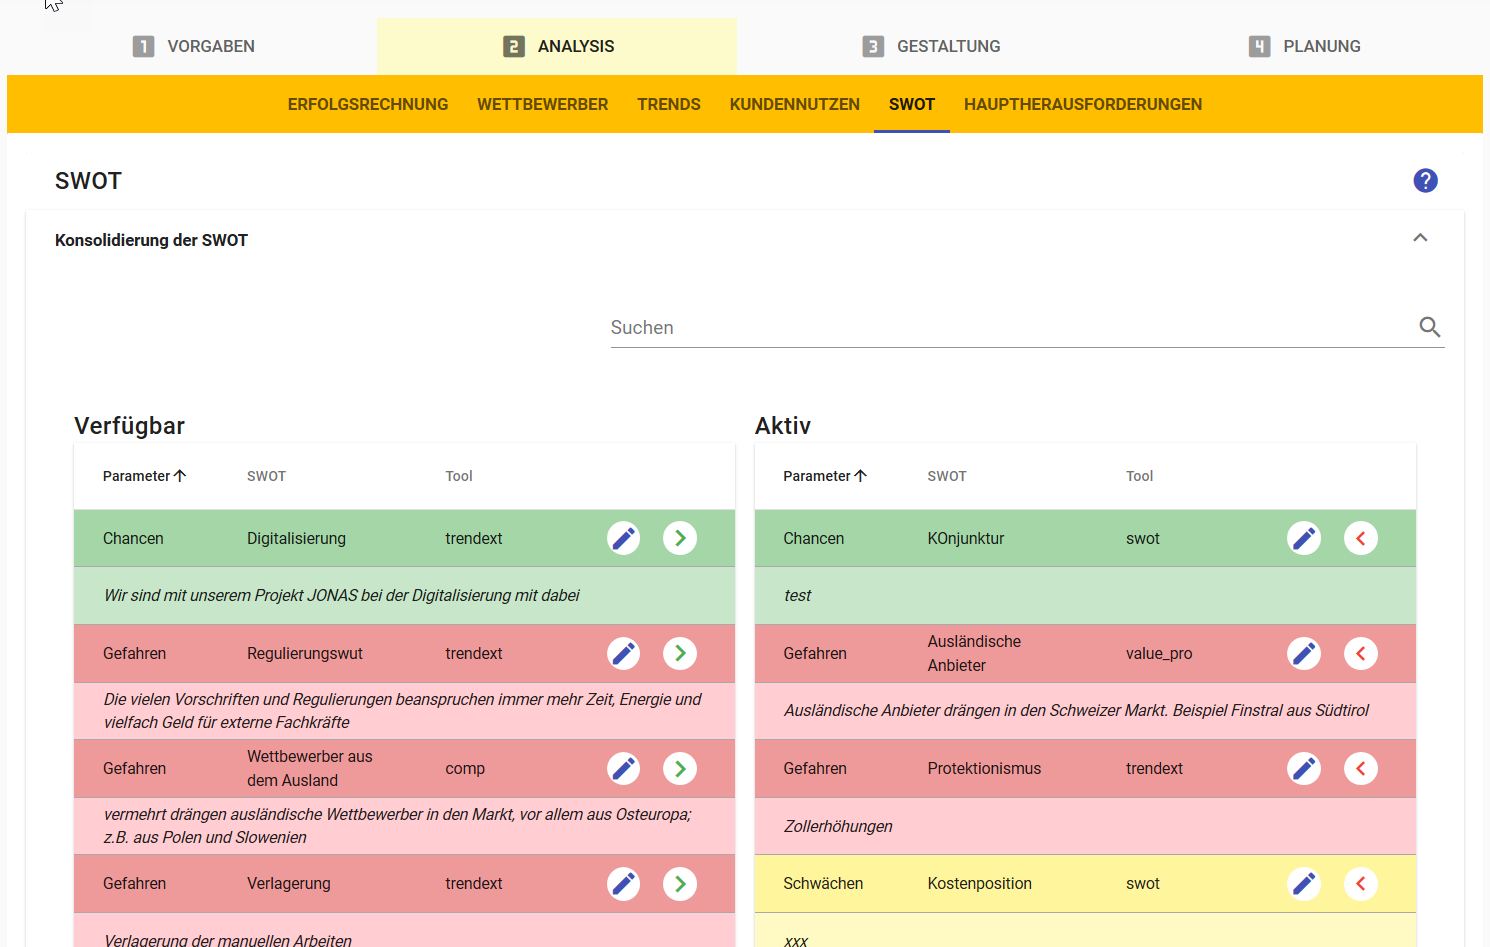
This gives us a concentrated overview that we can use to create options.
Challenges
The main challenges are derived from the SWOT. This is done in an "analogue workshop" - with card and plenty of space. The instructions can be found under the download icon on the top right. The result is a list of approximately 10 - 15 major challenges, each associated with a quadrant. The main challenges thus worked out are now entered as a list with title and description as well as indication of the quadrant.
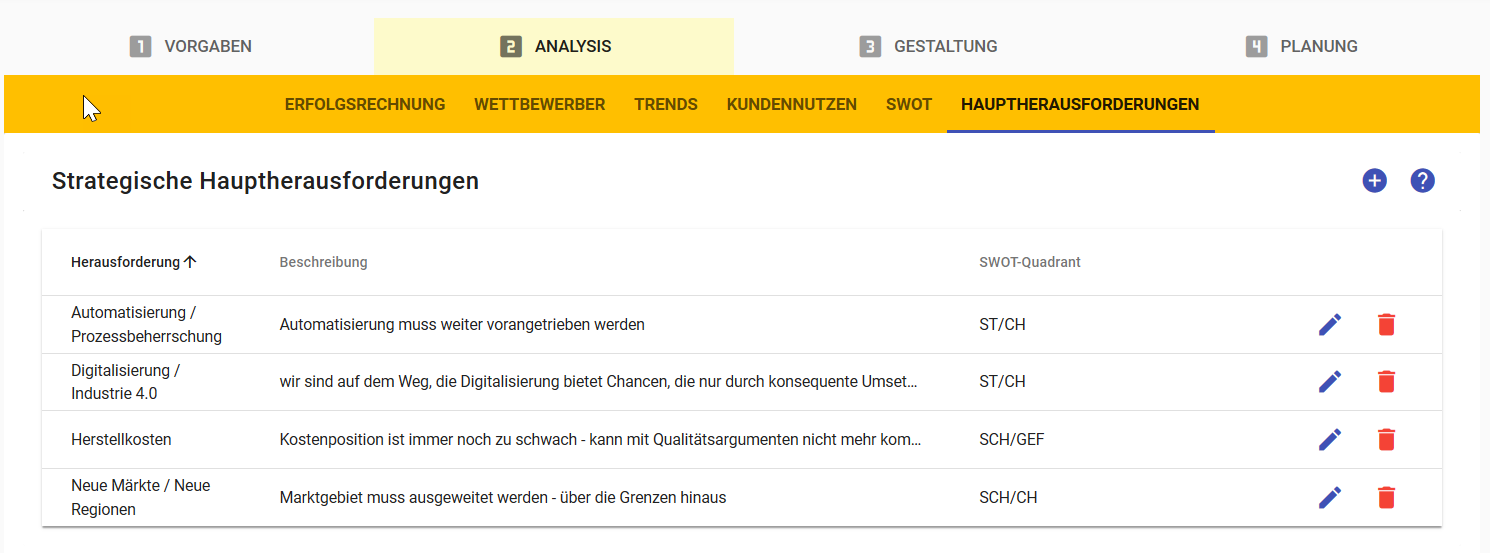
These key challenges will be compared with the strategic options in the next phase. This can be used to check whether the strategic orientation is consistent or whether there are strategic gaps.
Design Phase
The design of the strategy takes place almost exclusively at the level of strategic business units (hence the name).
The design phase at the buniness unti level is divided into the following steps:
- eBMC tomorroe
- Options
- SWOT-GAP-Analysis
- Strategic Directions

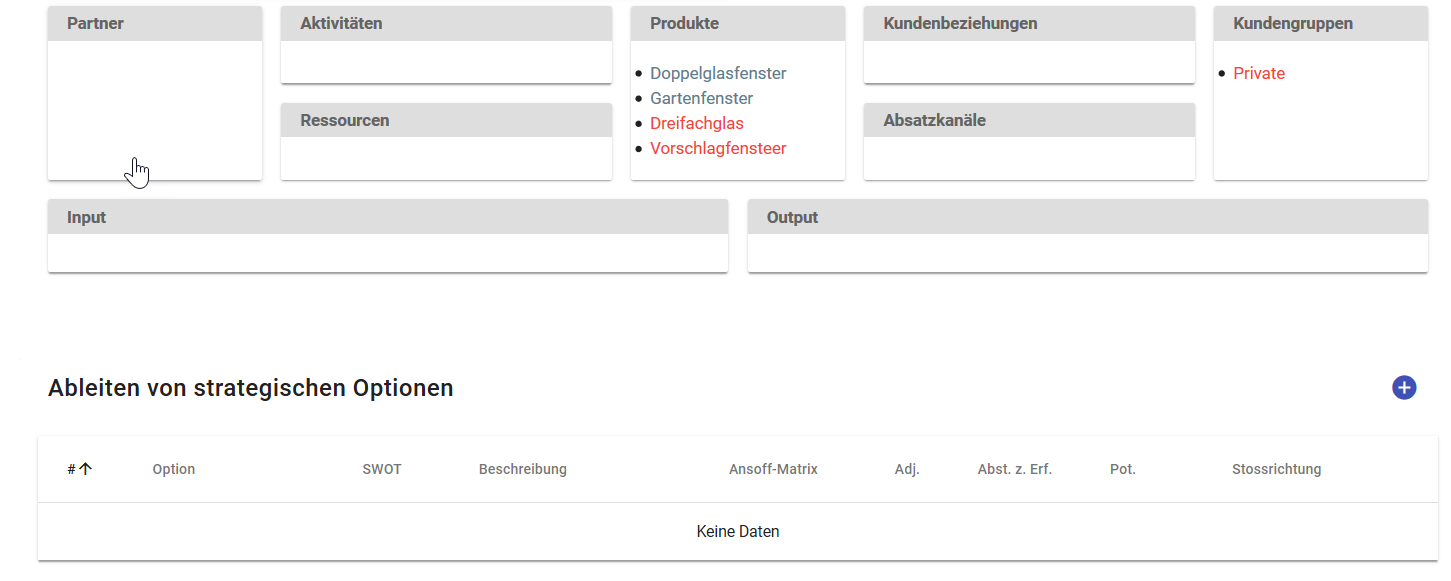
eBMC Tomorrow
First of all, we start with our eBMC. The elements that we have created in the presets appear. Now we can add ideas and options for the future. These appear in a different color.
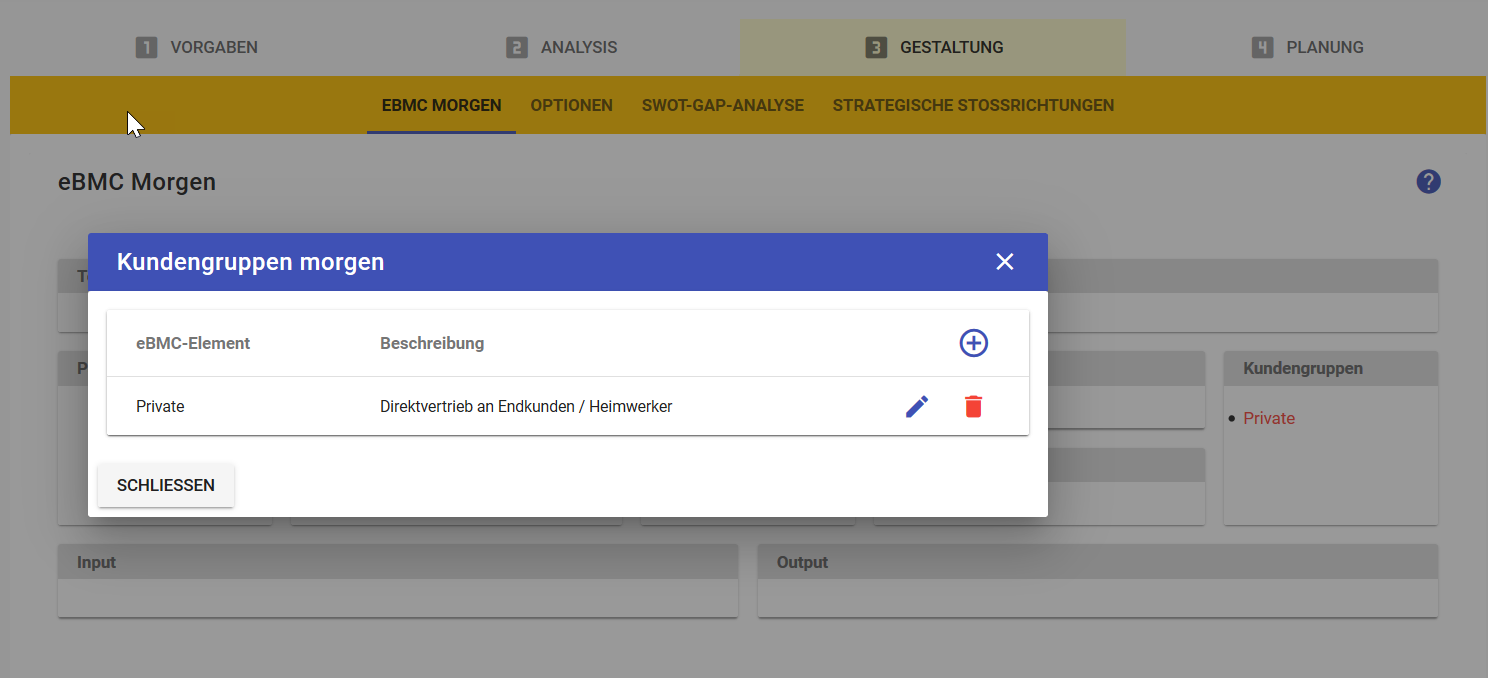
Below the eBMC model, the first concrete strategic options can be derived.
Options
We derive further strategic options from the so-called extended SWOT - in each case from one of the quadrants that we have defined in the parameters:
- Strengths / Opportunities -> ST / OP
- Opportunities / weaknesses -> OP / WE
- Weaknesses / Threats -> WE / TH
- Threats / Strengths -> TH / ST
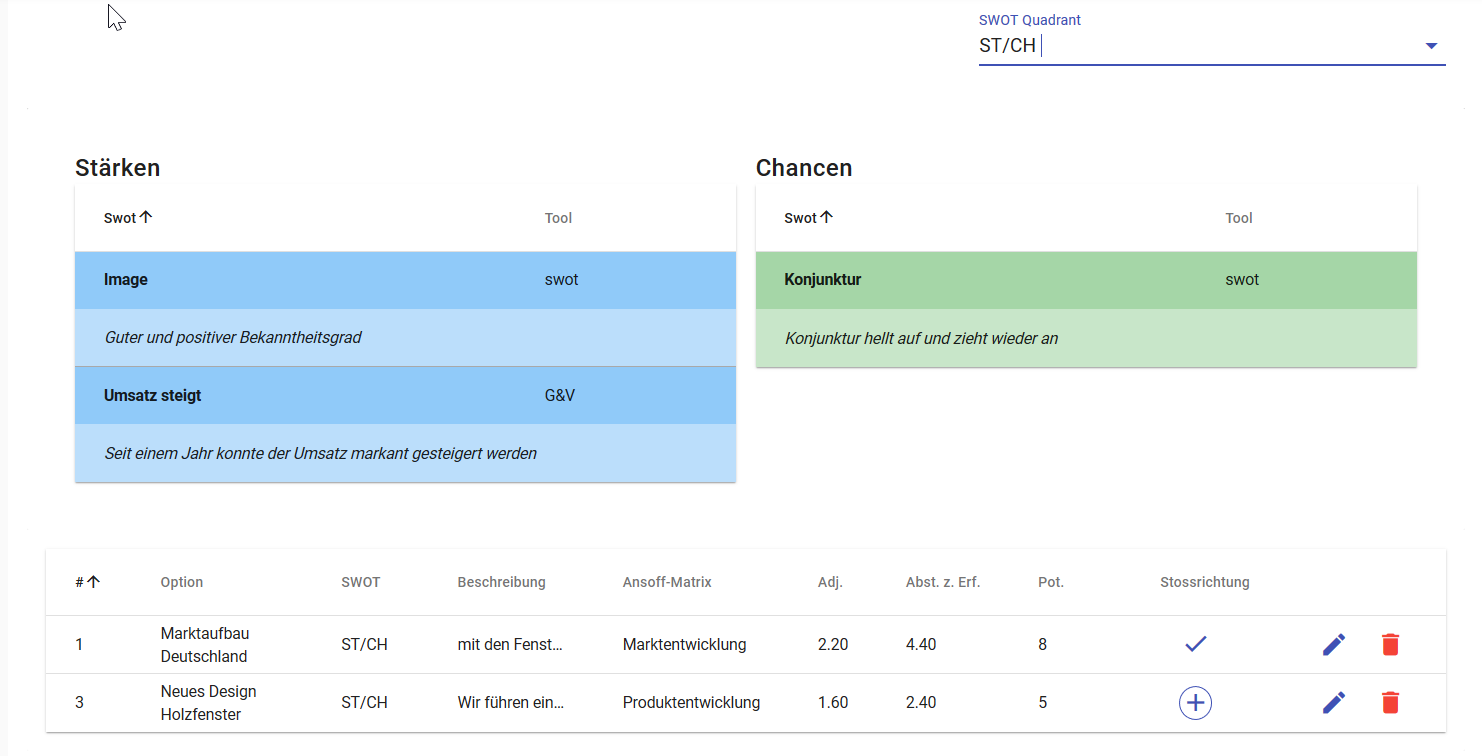
The options are described in the dialog according to the form and then the values for the adjacencies are listed:
- Adjacencies * Customer * Customer problem * Products * Regions * Technologies
- Distance to success * Investment * Duration until first sale * There is already a market today * Building know-how
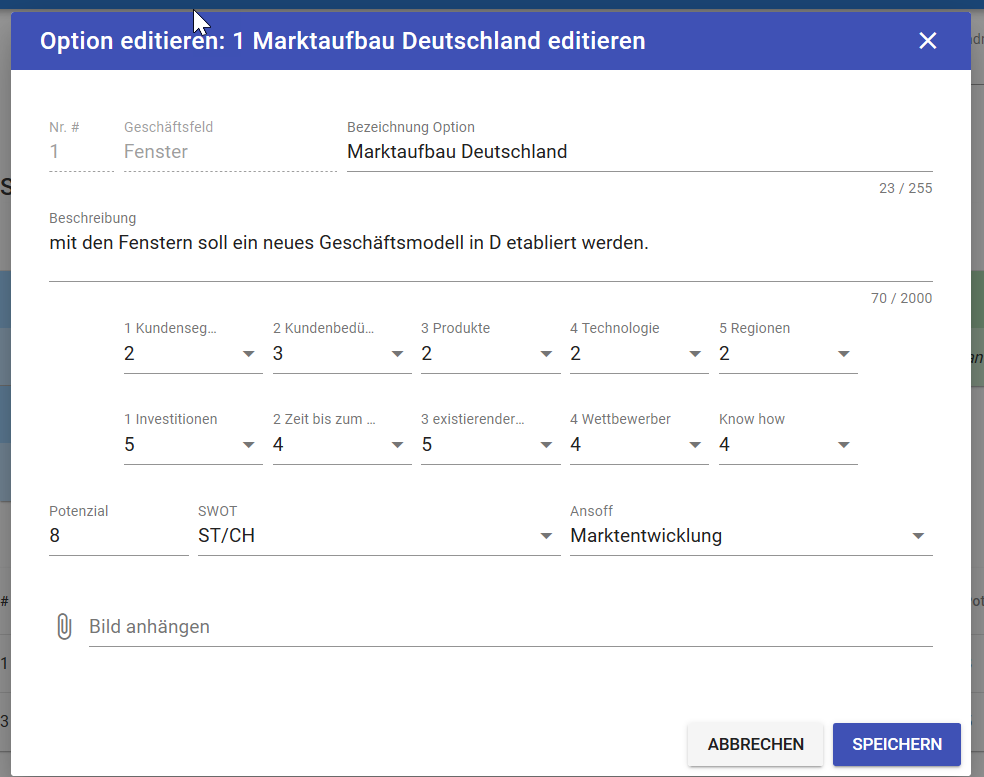
We give each of the parameters a value between 1 and 5 with the following meaning:
Evaluation of adjacencies (y-axis)
| Value | the option |
|---|---|
| 1 | ... is part of the core business |
| 2 | ... is close to the core business |
| 3 | ... is further away |
| 4 | ... has little to do with the core business |
| 5 | ... moves in completely new realms |
Evaluation for the distance to success (x-axis)
| Value | the distance |
|---|---|
| 1 | ... is low - business can be realized immediately |
| 2 | ... is low |
| 3 | ... is in not to big |
| 4 | ... is high |
| 5 | ... is very high - it has to be invested a lot and takes its time |
In addition to the values for the Adajcencies, we give an initial estimate of the potential, on a scale of 1 to 10. 1 means: the potential is very low, 10 means the potential is very high. Which values you use for this scale depends on the nature of your business and can be determined by you. As a rule of thumb: For a potential of the order of 10% of the turnover (of the company) we suggest 10 points.
SWOT-Gap-Analysis
With the SWOT gap analysis we do a first consistency test. For every major challenge we have derived from the SWOT, we should have at least one option that gives an answer. We do this test with a simple crosstab - with the options in the vertical and the main challenges as columns.
- If a line remains empty on the horizontal axis, there are options that pass the main challenges.
- If a column remains empty on the vertical axis, there is no strategic answer to a main challenge.
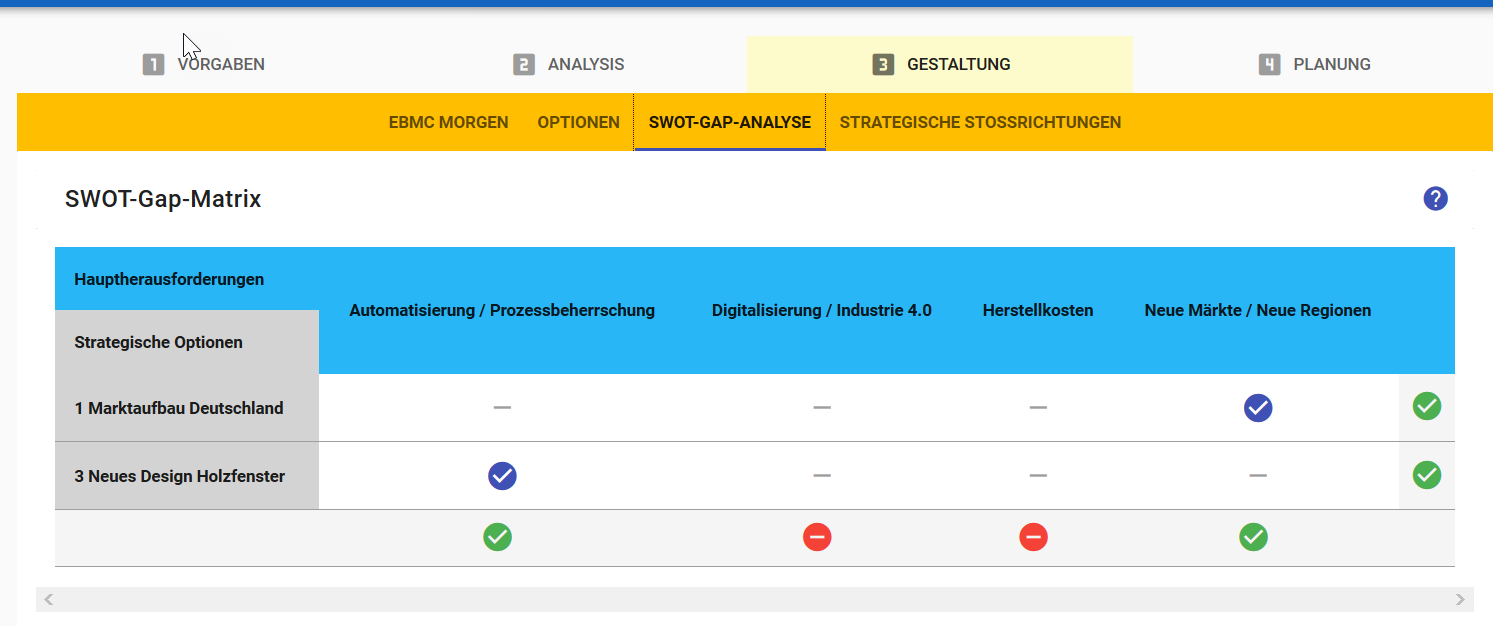
In both cases it is worthwhile to go over the books again.
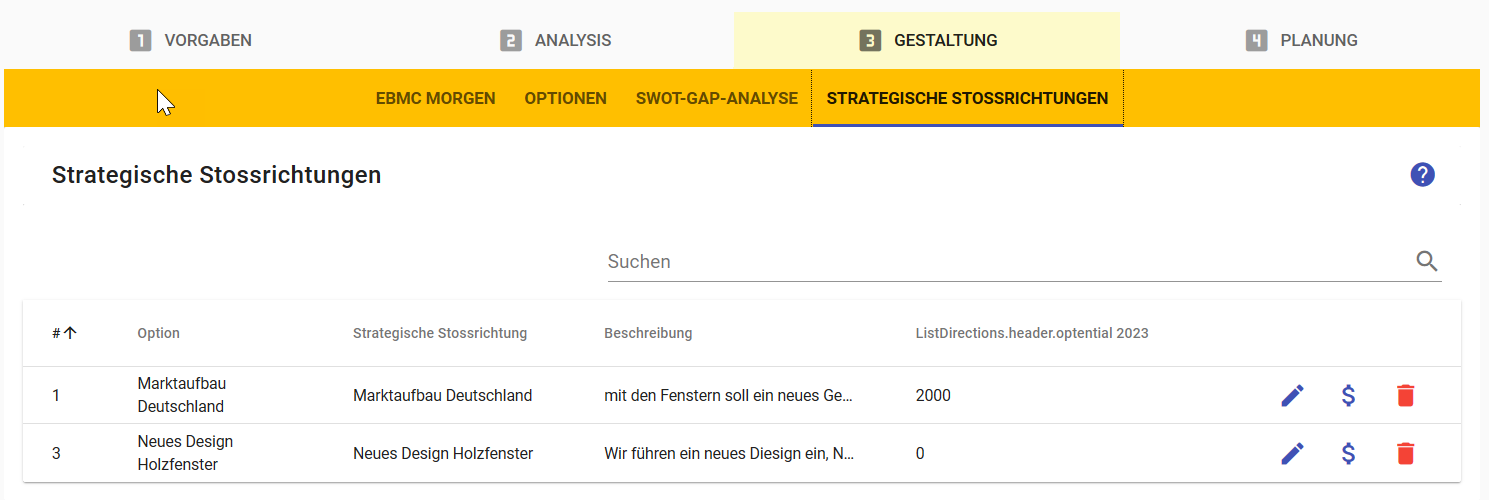
Strategic Directions
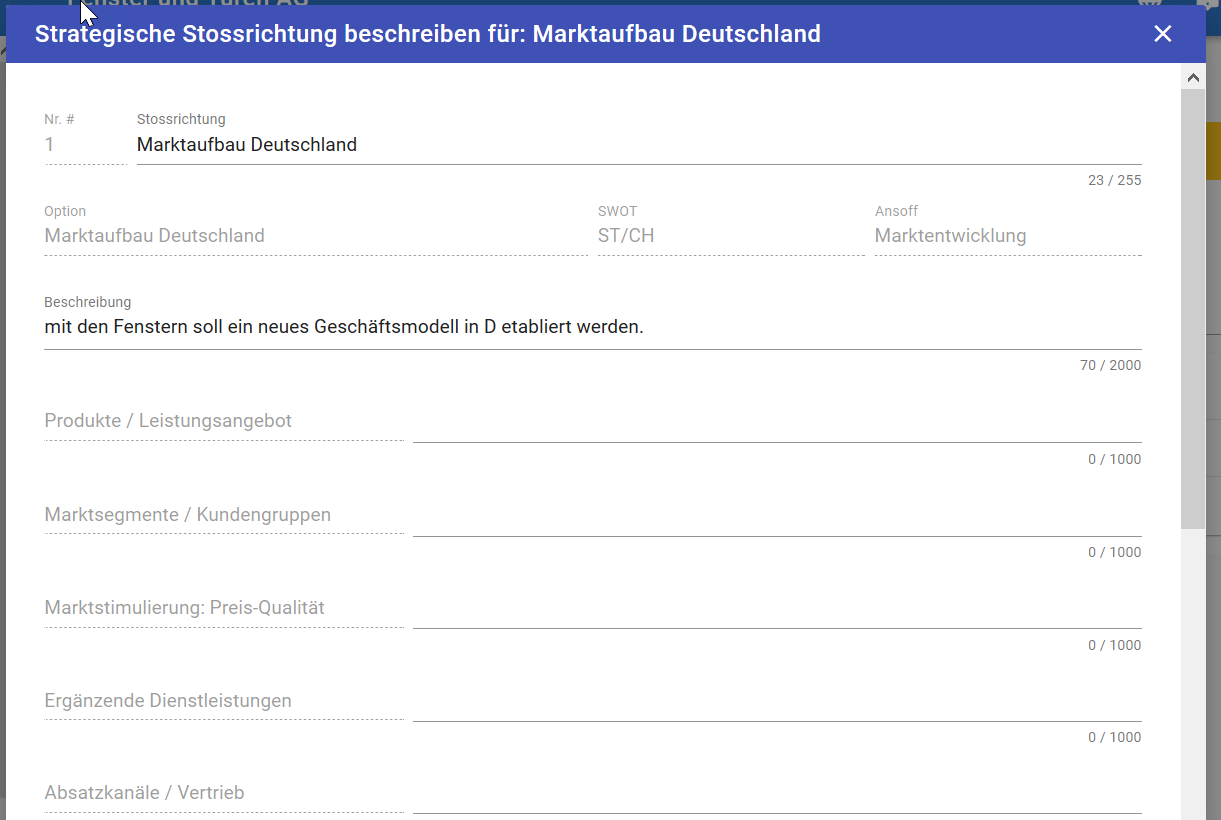
Strategic direacitons are elaborated options. They are created from the options and concretely described on the basis of the given description fields. In addition, they are quantified, i.e. with potentials in the form of sales and CMs.
The description of the strategic directions follows the specifications entered during the parameterization of the instruments.
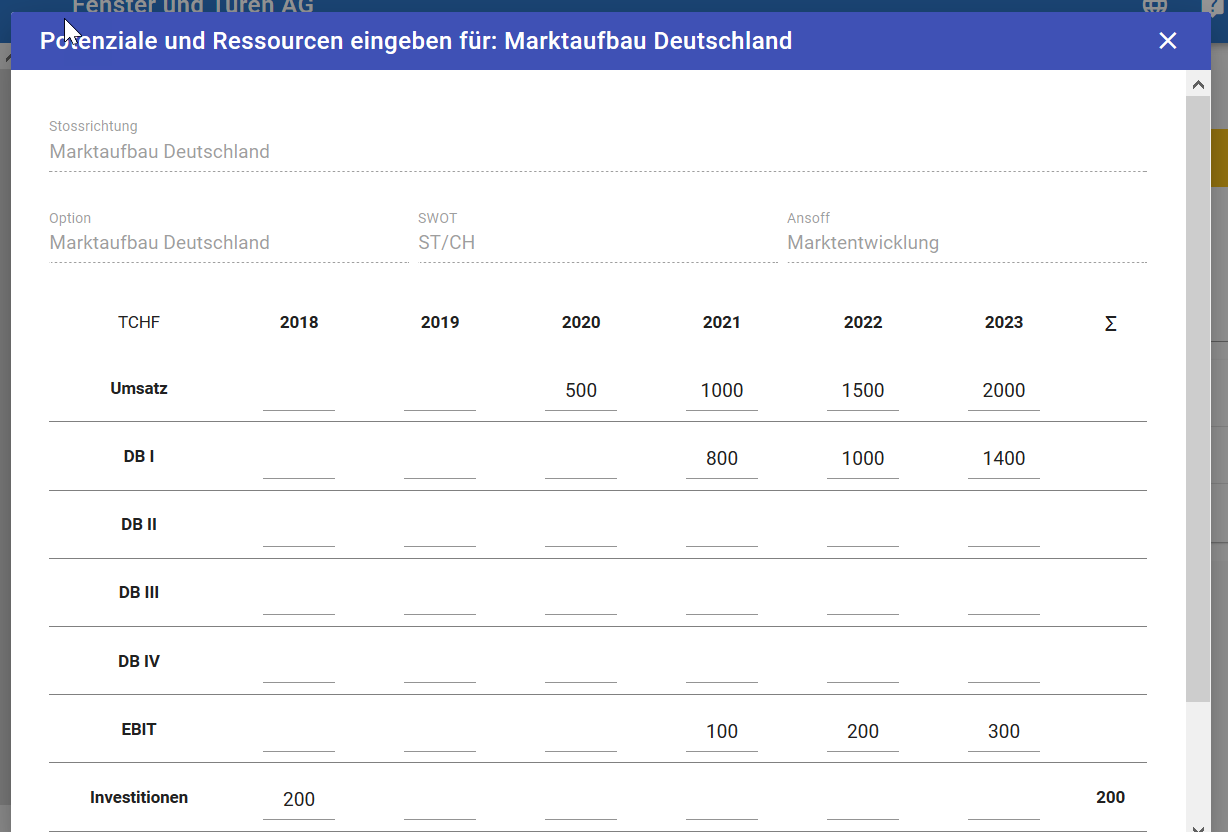
The potentials are entered in the following years. These relate to sales, margins and contribution margins, as specified in the chart of accounts. In addition, there are the two key figures investments and additional employees:
Planning Phase
The planning is divided into three steps
- Roadmap
- Financial Plan
- Measures

Roadmap
Here we compare the developed strategic directions with the requirements. With which strategies can the goals be achieved? Here we can switch directions on and off and see how we can achieve the given goals.
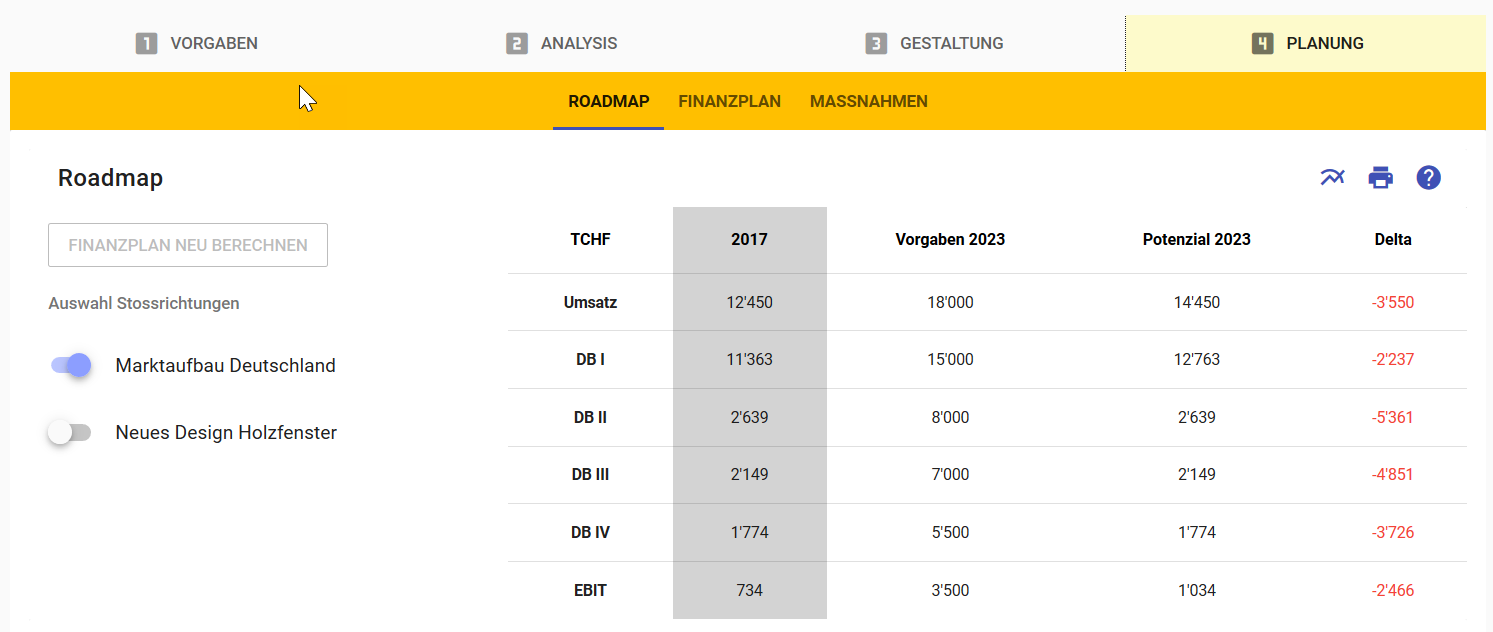
The graphic shows the presets, the potentials and the deltas
The selection of thrust directions is saved and then serves as a template for the financial plan. If something is changed, this template can be changed and the financial plan recalculated.
Recommendation: If the potential of all directions is about
twice as large as the projections, then we have
enough leeway.
- Set priorities by selecting the most promising directions.
- Make scenarios and try to present a worst /
real and best case scenario
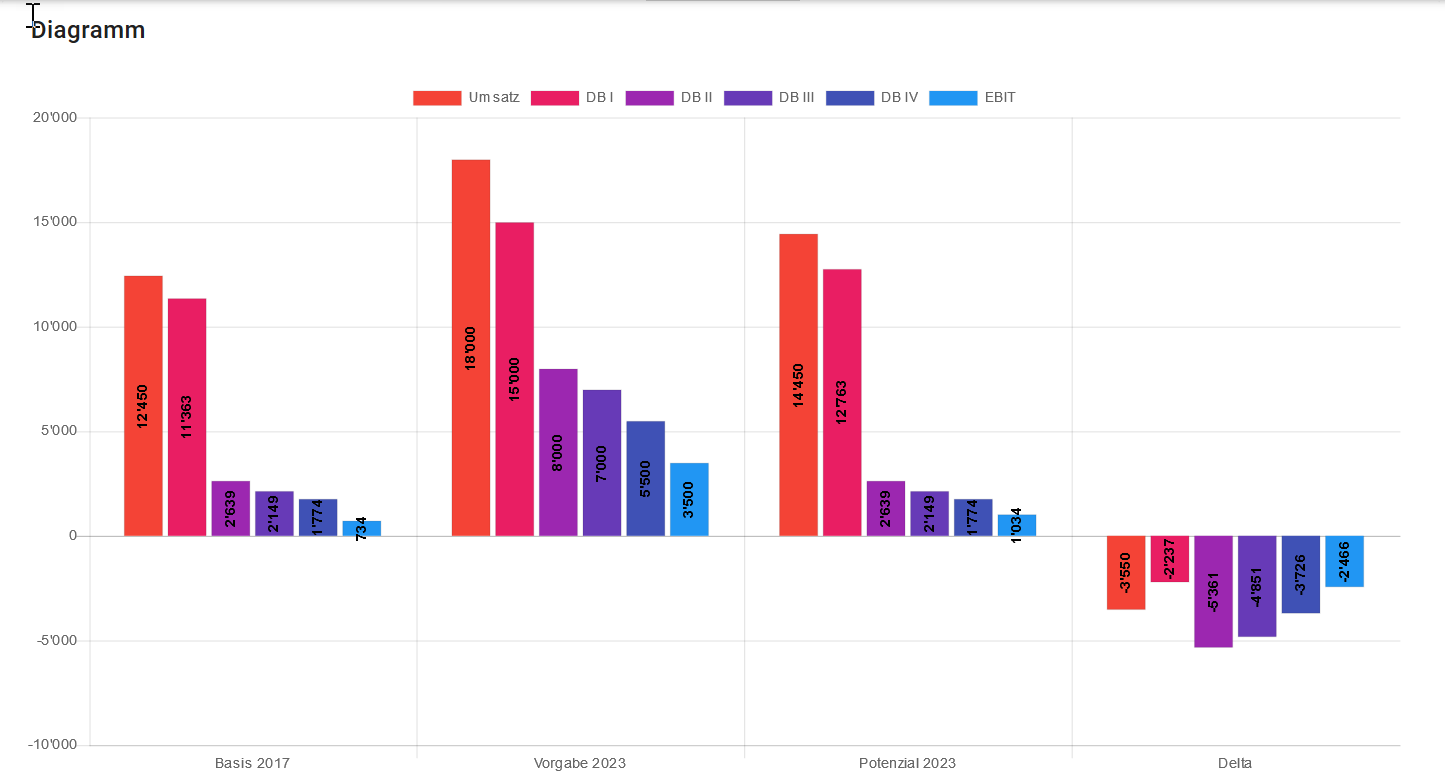
Financial Plan
The financial plan is calculated from the roadmap and shows which goals are achieved. For each goal, the difference between potential and requirements is shown.
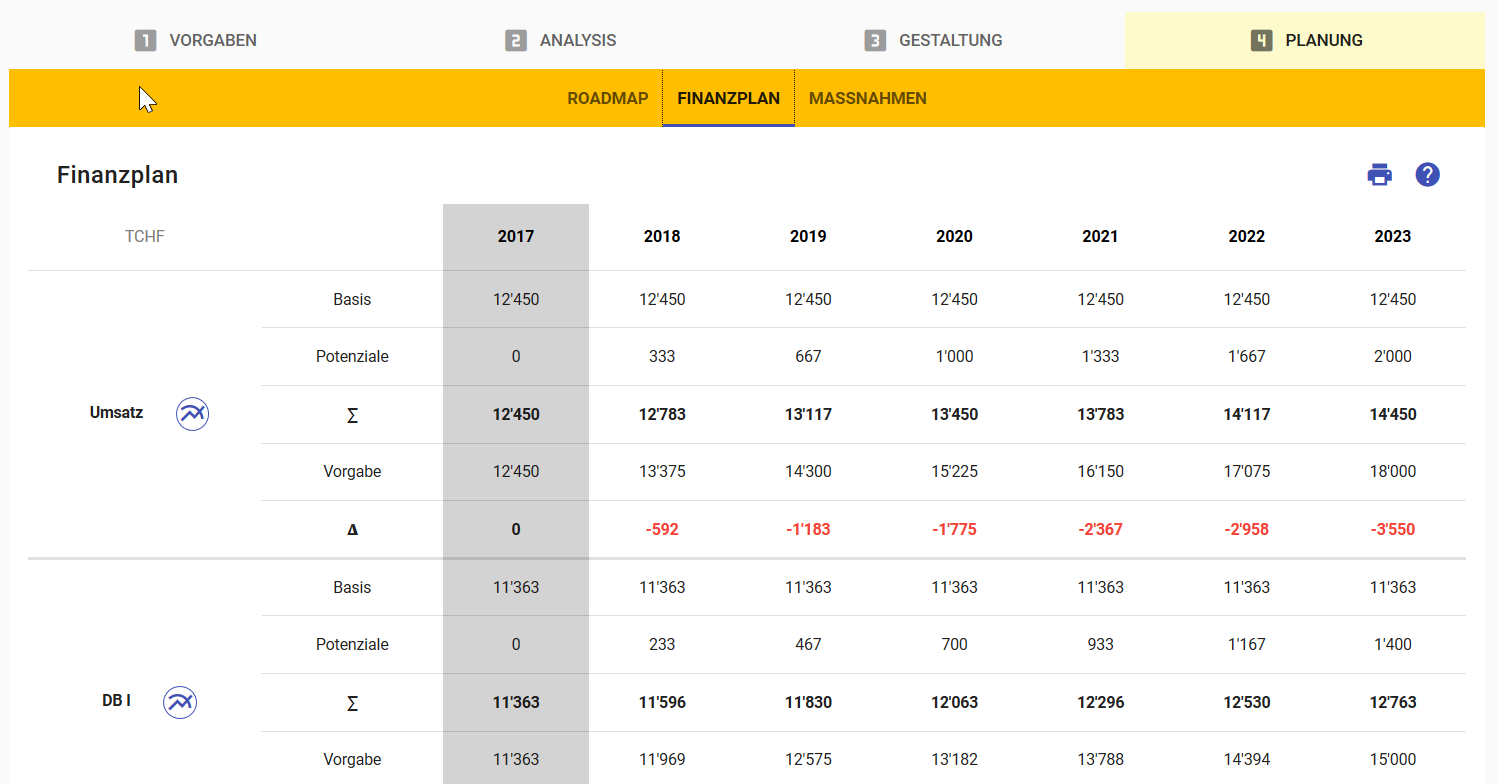
For each number, the following values are displayed:
- Base from the last completed year
- Potential as a buzzer of all directions
- Sum of possible results
- Specifications from the objectives
- Delta of requirements to results
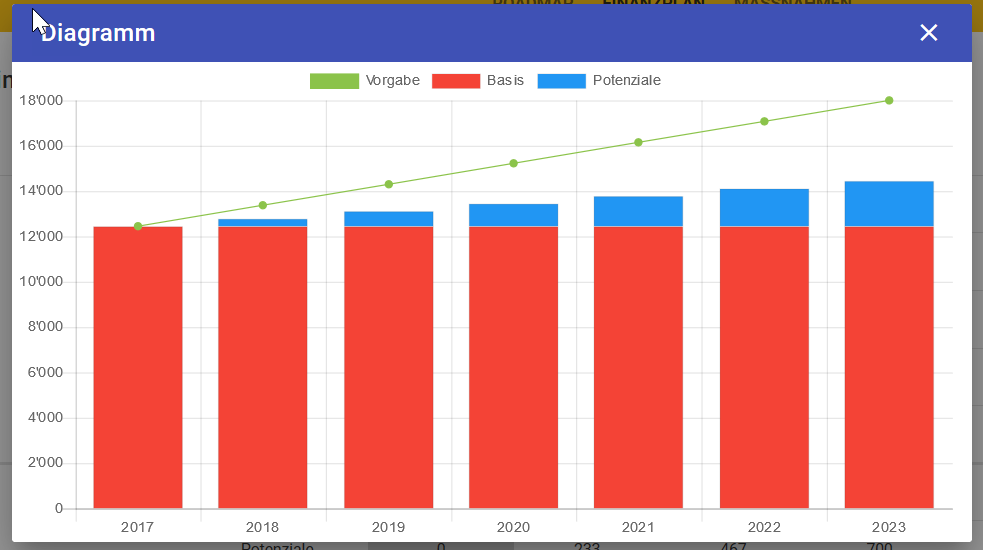
For each key figure a chart can be created and printed out.
Measures
All the measures that were created in the course of the process are presented here in a consolidated list. The measures can be created on two bases:
- Strategic directions: For each direction marked in the roadmap and included in the financial plan, measures and activities can be created
- Main challenges: For every major challenge from the SWOT, measures and activities can also be defined. This is useful if you want to create measures directly from the SWOT without going through the options - strategic directions
- roadmap and budget.
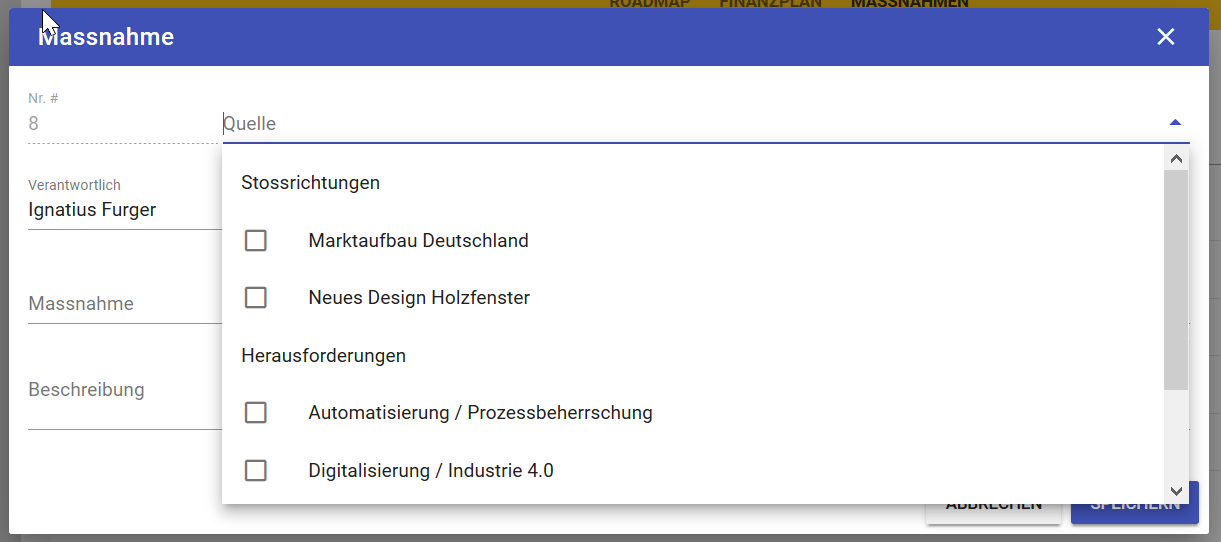
The measures are displayed as a list:
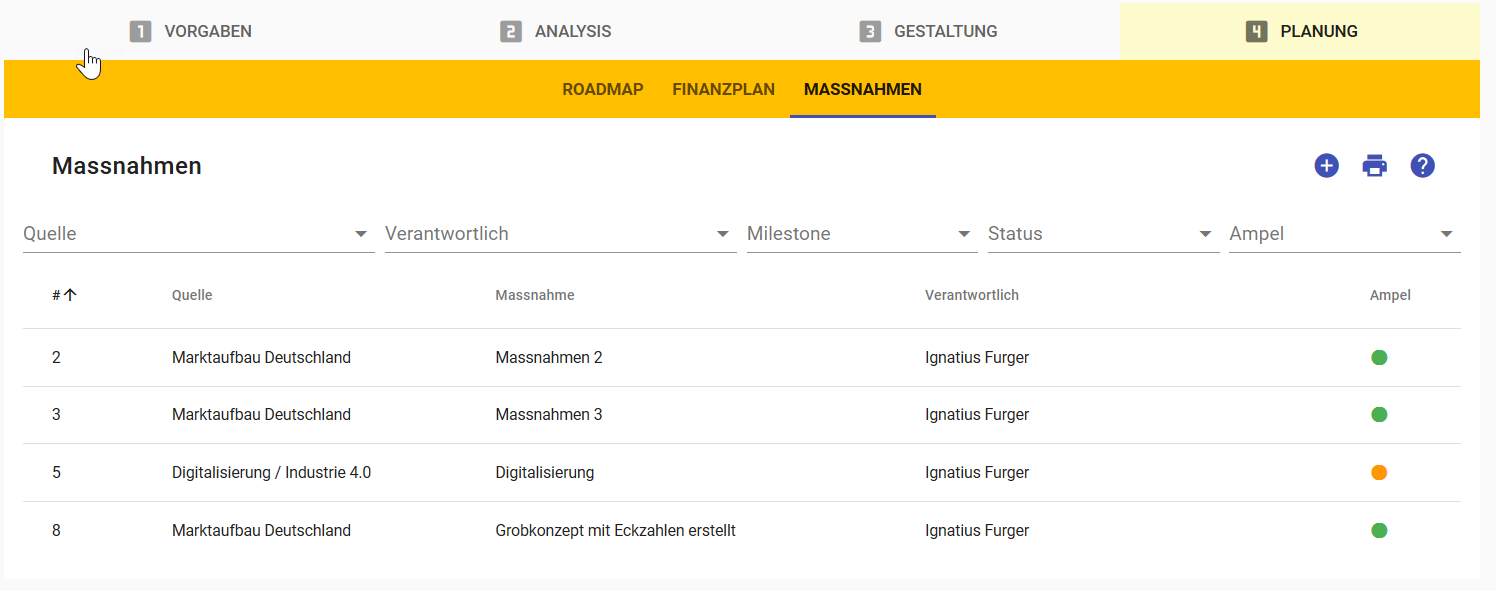
By clicking on a line, the corresponding measure is displayed in detail:
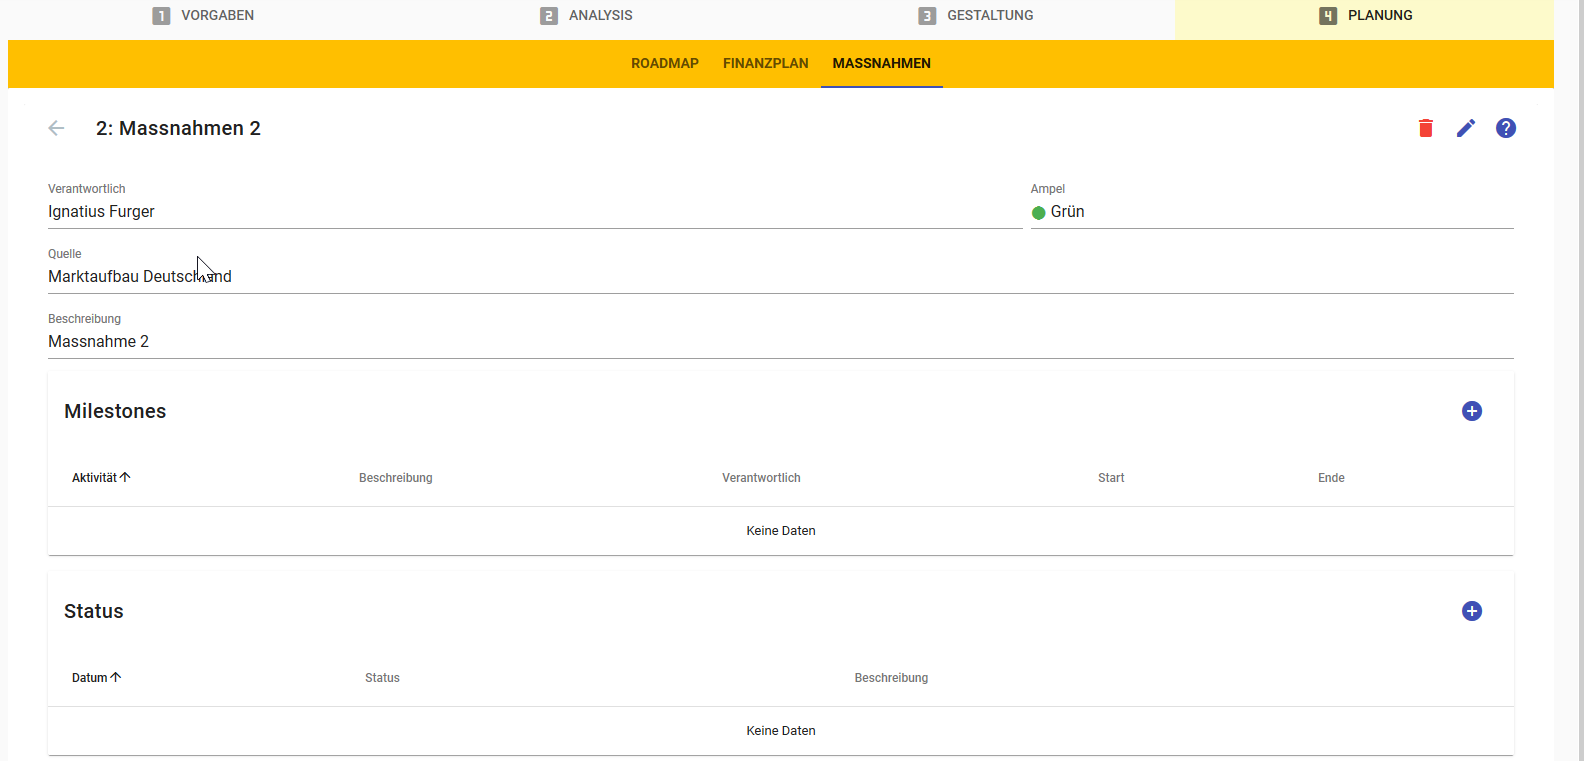
Any number of milestones can be created for each measure. The data, i.e. Start and end are entered for the milestones. The measures take as the beginning the smallest start date and as the end the largest end date of the Milestones.
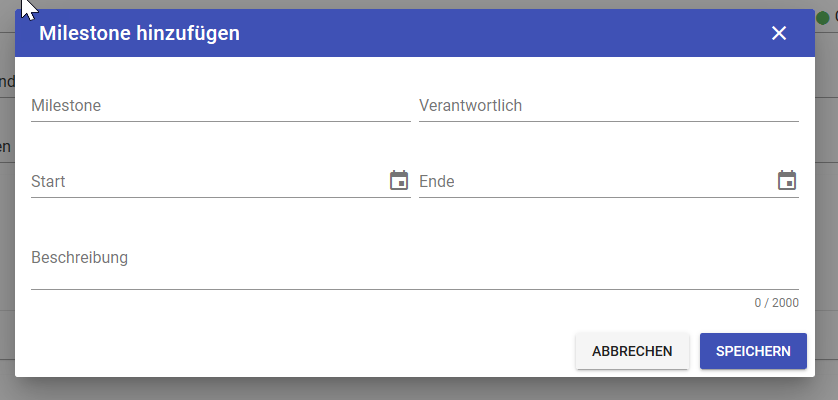
A measure is usually divided into three to five milestones.
The traffic light is only entered at measure level and can have three values:
- green: everything ok
- yellow: attention, could get out of hand
- red: danger, the measure is in danger and must be revised
It is up to the user to define the meaning of green-yellow-red.
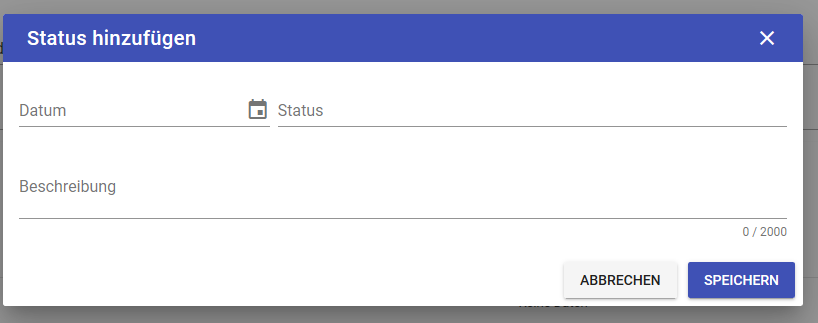
Statements can be added or changed at any time to the measures. These are listed in chronological order and thus chronologically indicate the development of the measure.
Note: we do not create an activity plan here that we track every day. It's about recording the results. It is a question to show the results. Also, we will not set up project management here. There are other tools and the strategic management of a company is not interested in the daily work, but only in the result.